

Is it possible to glean insights from the Volume of News Stories?
Reuters has a long history of market-moving beats and exclusives related to macroeconomics, M&A activity, CEO changes or corporate wrongdoing.
Refinitiv News offerings - both Live streaming and Archived format - deliver Reuters News' unrivalled company, commodity and economic stories formatted for automated consumption. We have live streaming and archived versions of our news and news sentiment scoring.
By delivering Reuters News in these algorithm friendly formats, you can gain a competitive advantage in your implementations.
Earlier in 2021, along with my fellow Dev Advocate Zoya Farberov and the Head of News Feeds and Analytics Amit Das, we presented a Webinar which explored a few ideas on how you could glean insights from our News data.
Zoya previously published an article which covered the material she presented and below I will summarise the content that I covered with Amit.
In this article, I will cover two of the areas that we explored in the Webinar:
- Detecting which Topics are getting greater News coverage?
- What impact can Sustained News Coverage + Sentiment have on an assets price?
How do we detect which topics/industries are getting lots of news coverage?
It is important for various players in the financial market to understand the changes that affect the market and consequently their portfolios.
To address the above, we would need several components in place.
- A comprehensive classification scheme that would cover all the topics and industries - Refintiv classification schema has thousands of topics & industries - categorized for ease of discovery
- A good set of News sources that would cover all the pertinent topics/industries across the globe - think Reuters, News wires
- A feed of all the sources in one data format/schema so that one can easily ingest and query the data
At the time of the presentation, Covid was still at the forefront of world news and its impact on the financial markets and the world economy. Therefore it made sense to explore the volume of Health-related stories. In order to do this I:
- Pulled Historical News stories from Refinitiv News sources on Diseases related Topic codes
- Charted the Volume of stories for each Topic Code
- Compared the Volumes for related Topic codes
Health-Related Topic Codes
| RCS Code | News200 Code | Topic | Description |
|---|---|---|---|
| M:1N7 | COMDIS | Communicable Diseases | General news on research into, causes, prevention and treatment of communicable diseases |
| M:1N6 | DISEAS | Diseases | General news on research into, causes, prevention and treatment of diseases |
| M:JJ | INFDIS | Infectious Diseases | Research into, causes and treatment of all infectious diseases, including food poisoning, hepatitis, influenza, malaria and sexually transmitted diseases (STDs) |
| M:1LP | PUBHEA | Public Health | Issues and policies affecting Public Health systems, including disease outbreaks, disease prevention programs, disease control programs, health trends, municipal resources, public education, public policies |
| M:1LD | HCPOL | Healthcare Policy | Health insurance, law, government policy about healthcare |
| M:P | HEA | Health/Medicine | Health; disease; medical research; preventative medicine; hospitals; government policy |
The RCS topic code is the newer strategic system and the News2000 code is the legacy system.
For all new developments, we recommend customers use the RCS code (Refinitiv Classification Schema) - News2000 codes & RSC codes are one-to-one mappings ~99% of the time.
Realtime Streaming and Archive Files
Depending on your use case, you can access our News Stories and Sentiment scoring data as
- Live Streaming Feed
- Archived Bulk File versions
For my presentation, as I wanted to analyse volumes, I used Bulk File data - which my colleague Zoya had already transferred into a database (as detailed in her article).
To speed up the demonstration, I dumped the database into a spreadsheet file. This had the added benefit of allowing you to run the demo code Jupyter Notebook without having to set up a database and import News Archive files into it.
To use the spreadsheet file, you need to ensure the loadFromXl variable is set to True in the demo code.
datafile="Health.xlsx"
myConn = ""
writeToXl = False # Used to dump data to excel file after sourcing data from DB
loadFromXl = True # Load data from Excel file rather than DB
If you refer to the demo code, you will note that I have a function to retrieve News Story volumes by Topic Code (from the Database or from the XL file) where the SQL query is performing a COUNT of the number of the stories per day in the database - filtered on Topic Code.
Note that I also filter out weekend stories to smoothen out the chart (as there tend to be far fewer News stories on the weekend):
"SELECT feedDate as Date, COUNT(*) as " + code +
" FROM news "
"WHERE subjects "
"LIKE '%N2:" + code + "%' "
"AND WEEKDAY(feedDate)<5 "
"GROUP BY feedDate "
"ORDER BY feedDate"
If I then fetch and chart data for the various Topic codes, we can easily see if there is much to be gleaned from the volume of News Storys.
Infectious Disease News Stories
Firstly I fetched and plotted the volume of stories which included the Infectious Disease Topic code.
Note: Whilst we recommend using the RCS codes, I decided to use the legacy News2000 code 'INFDIS' - purely because it is more relatable in the context of a demo.
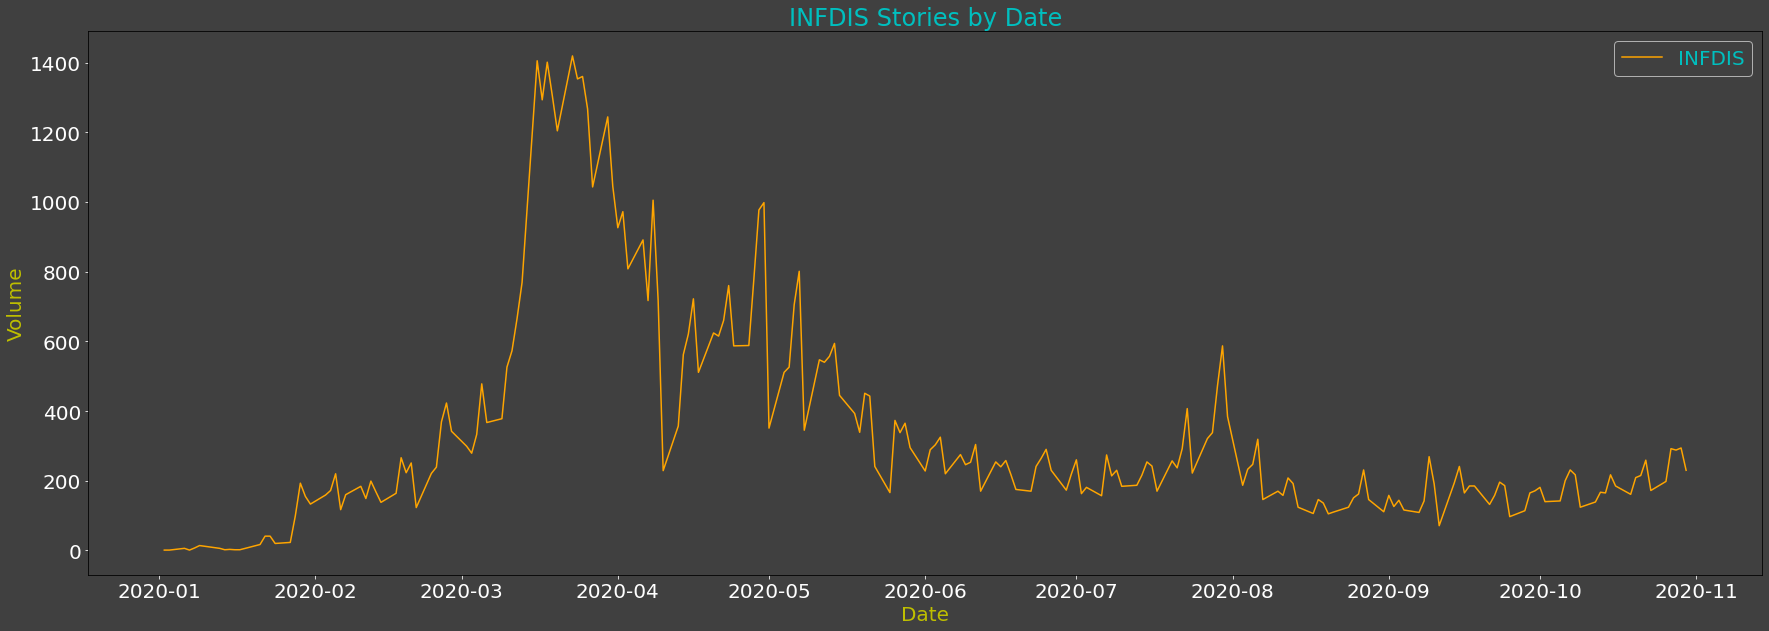
Looking at the chart, you are immediately drawn to the massive volume peak in March - April and another spike in August with the volume of stories increasing by a factor of approx. 3 during March.
However, the potentially more interesting activity is actually what happened from late January to March:
- Note how the normal daily volume at the start of the year is very low - around the 10-20 stories a day
- From late Jan this starts multiplying so much that in early February this has increased by a factor of 10x to over 200+ stories a day
- By March we are getting between 400-500 stories a day - so an increase of a factor of 25x compared to the start of the year!
A savvy investor could have started to note the huge increases in late January and potentially started taking action.
Communicable Diseases - COMDIS - an infectious disease that is contagious
Next, I plotted the daily volume of stories for the COMDIS Topic code:
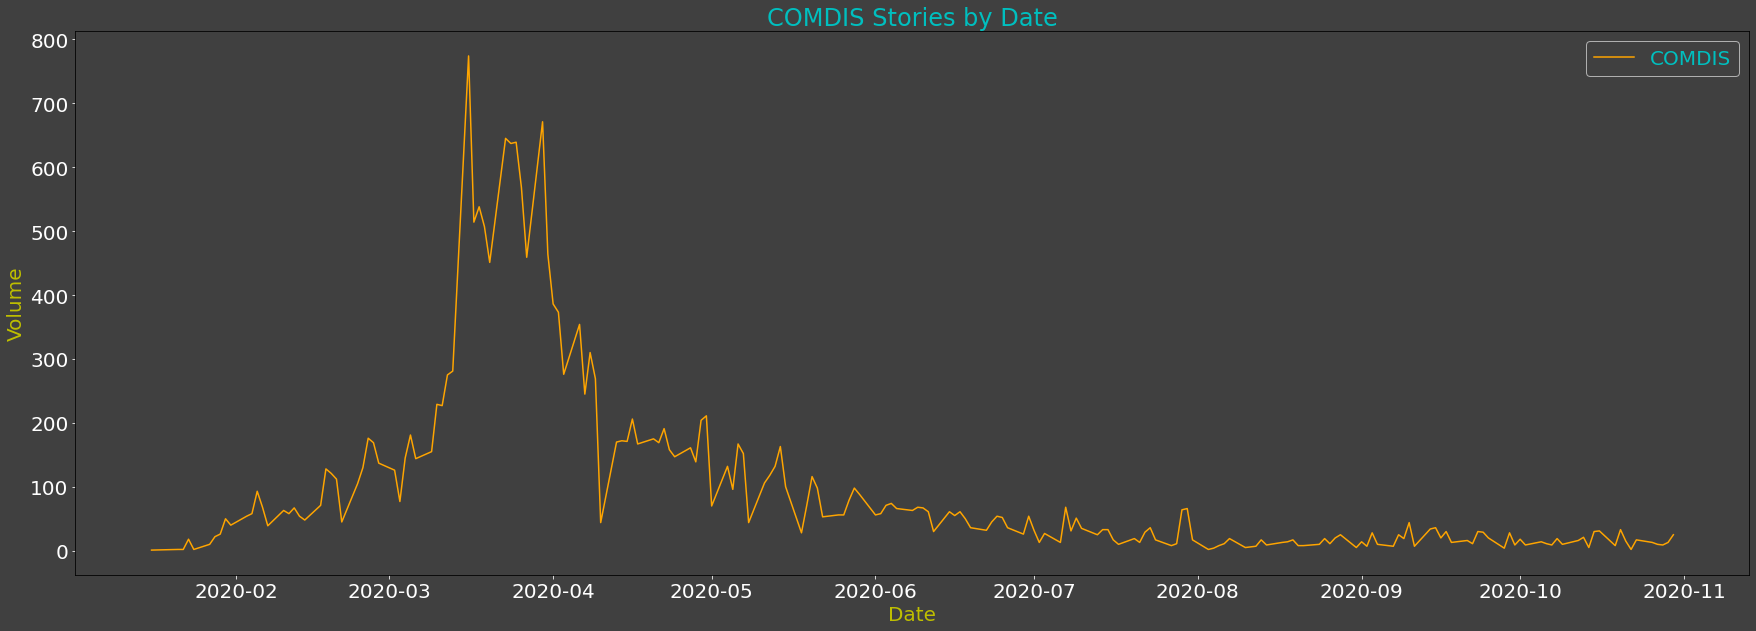
Note that whilst the overall pattern is similar to INFDIS, there is divergence in places and the average daily volumes are lower too.
General Disease-related stories - DISEAS
Likewise for the DISEAS Topic code:
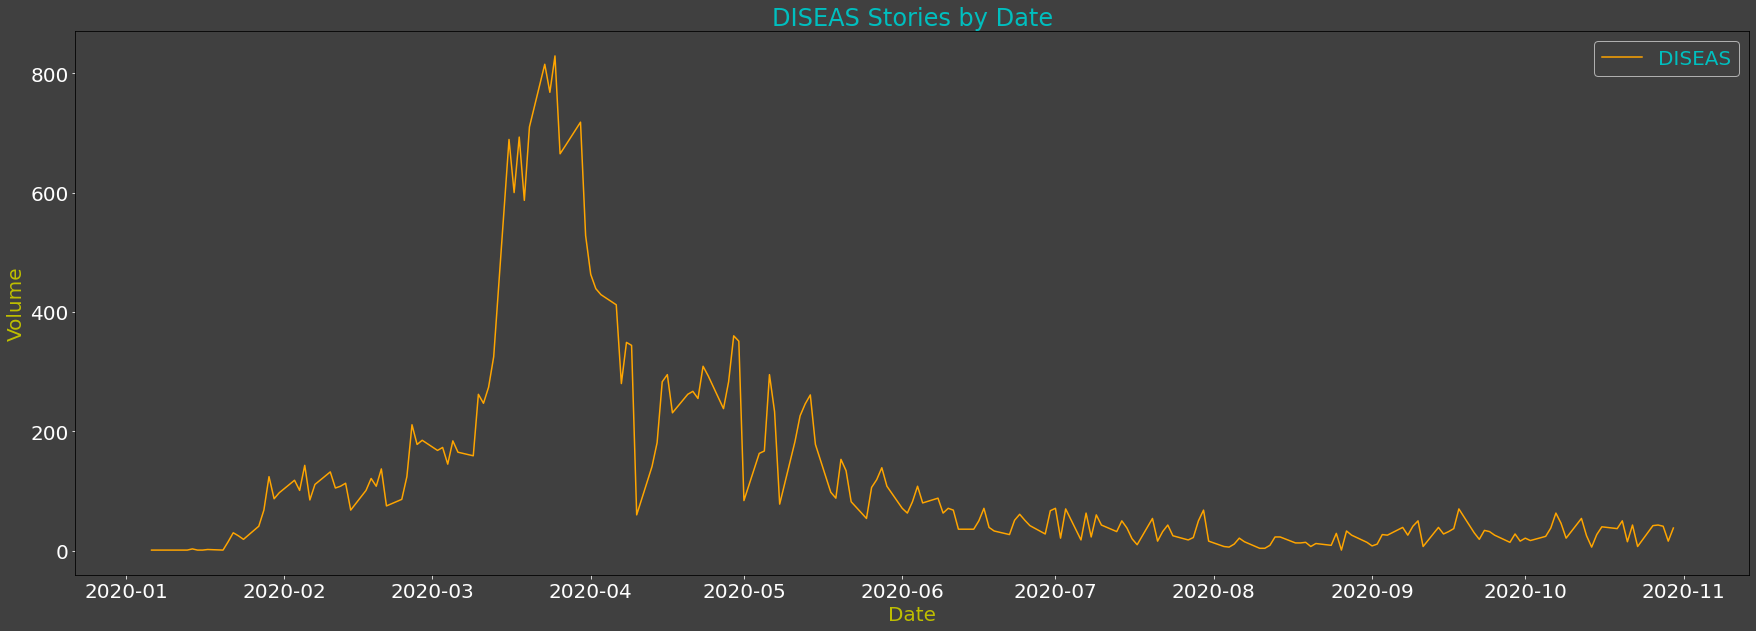
Once again, you will notice how the overall pattern was similar to INFDIS but there were divergences in places and the volumes were lower too.
Therefore, it is important to select the most appropriate topic code(s) as per your requirement. If you are unsure, you should consult a News Data specialist at Refinitiv.
Health Policy - HCPOL - Health insurance, law, government policy about healthcare
Moving away from Diseases, I then plotted the volume of stories for the HCPOL Topic code:
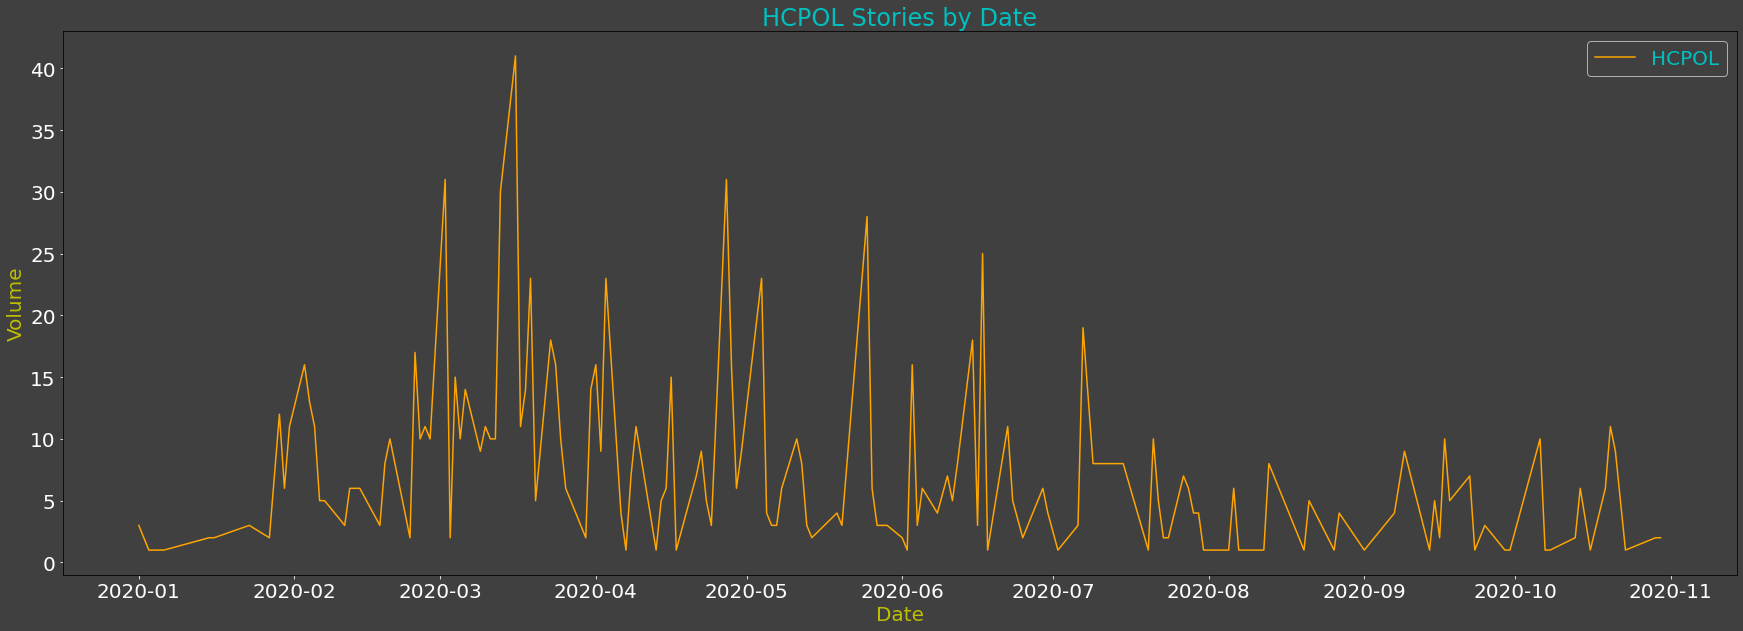
Notice how for HCPOL, whilst we see many more spikes, the overall pattern is somewhat different. This is most likely because Government policy announcements were made more often throughout the year.
Health/Medicine - HEA - Health; disease; medical research; preventative medicine; hospitals; government policy
The HEA Topic code is a catch-all code which can be used to capture all Health-related stories:
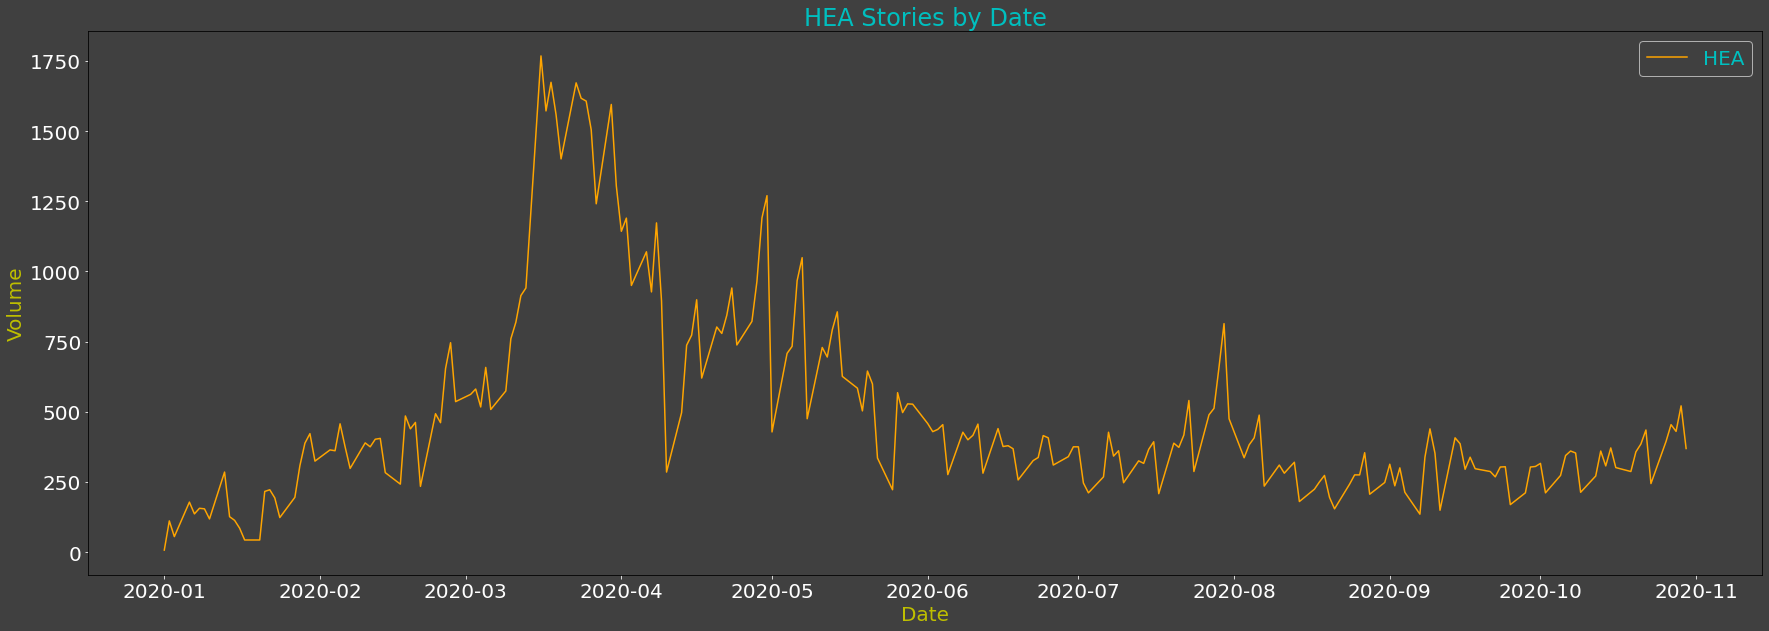
Given that it is capturing all Health-related stories, it makes sense to see the much higher daily volumes - a peak of around 1700 stories compared to 1400 for INFDIS and 800 for the COMDIS and DISEAS Topic codes we saw earlier.
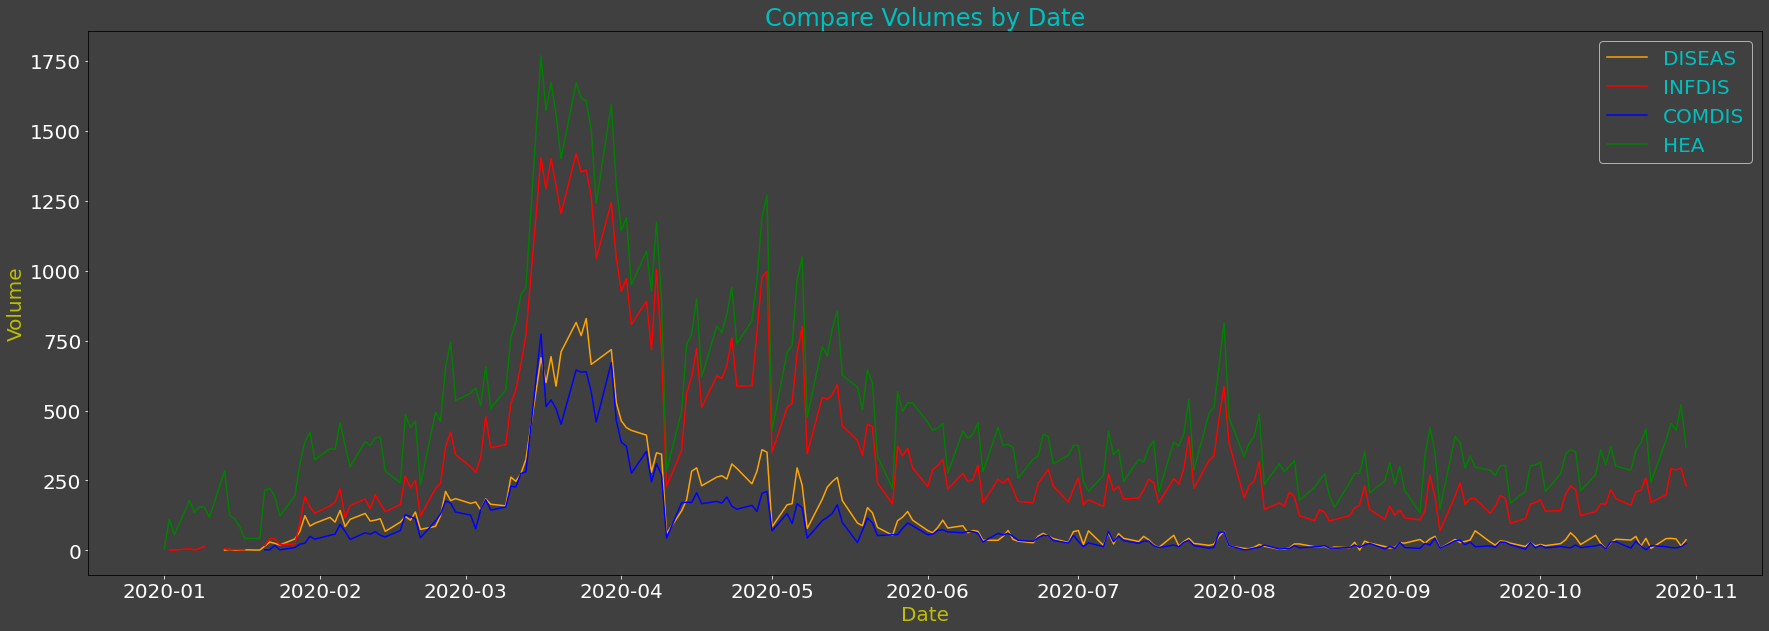
Compare Volume of stories for related Topic codes
I then compared the volumes for several Topic codes - just to allow us to compare and contrast the patterns and volumes:
Summary
As you can see, we can use the Topic Codes to measure the volume of News Stories being published for a given industry or topic - however, it is important that you select the most appropriate topic code(s) as per your requirement - something which a Refinitiv New Data specialist can help you with.
Any insight derived from analysing this data can be taken further by applying News Sentiment and Relevance scores to further refine the results of any such analysis.
I touch upon Sentiments scores in my other demo Notebook - Crude Oil - which we explore in the next section.
Sustained News Coverage - impact on prices?
Does sustained news coverage over an extended period have a greater impact on assets price compared to short-lived spikes in the volume of news stories?
How does the Sentiment affect the price?
To address the above questions, we could measure the volume of news stories for a topic over a period of time and contrast it with any price movement of the related asset.
To demonstrate this I can:
- Fetch historical News stories from Refinitiv News sources (including Reuters) for Crude Oil
- Fetch Sentiment scores for Crude Oil
- Fetch historical Crude Oil Price data for the same time period
- Chart the Volume of stories for Crude Oil
- Overlay the chart with the Crude oil price
- Add the Sentiment scores to the chart
A few key Crude Oil-related Topic Codes
| RCS Code | News200 Code | Topic | Description |
|---|---|---|---|
| U:45 | CRU | Crude Oil | Exploration, extraction, transport, processing, trading/broking, demand for and use of crude oil and gas condensate. Organisations associated with crude oil. |
| U:9U | AFRCRU | Africa Crudes | African crude oil streams |
| U:8J | AMCRU | Americas Crudes | Americas crude oil streams |
| U:9B | ASCRU | Asia Crudes | Asian crude oil streams |
| U:9C | AUSCRU | Australasia Crudes | Australasian crude oil streams |
| U:8T | CANCRU | Canada Crudes | Canadian crude oil streams |
| U:9T | EMACRU | Europe / Middle East / Africa Crudes | Europe / Middle East / Africa crude oil streams |
As mentioned earlier, the RCS topic code is the newer strategic system and the News2000 code is the legacy system.
For all new developments, we recommend customers use the RCS code (Refinitiv Classification Schema).
News2000 codes & RSC codes are one-to-one mappings ~99% of the time.
Realtime Streaming and Archive Files data delivery
As mentioned previously, our News Stories and Sentiment scoring data are available as a Live Streaming Feed and Archived Bulk File versions
As the objective of this exercise was to analyse volumes, I used Bulk Files data transferred into a database - as mentioned earlier. Once again, I dumped the data into an XL file - so that the example Crude Oil notebook could be run without having to set up a database and/or having the licence to access the required datasets.
NOTE : there are 2 versions of the Crude Oil Notebook in the above GitHub repo - one that uses the older RDP Library and an updated version which uses the newer RD Library replacement.
As before, to use the spreadsheet file, you need to ensure the loadFromXl variable is set to True in the demo code.
Fetch and Plot Volume of all Crude Oil related stories
To start with, I extracted the daily volume of stories with the Crude Oil - CRU Topic code and plotted them
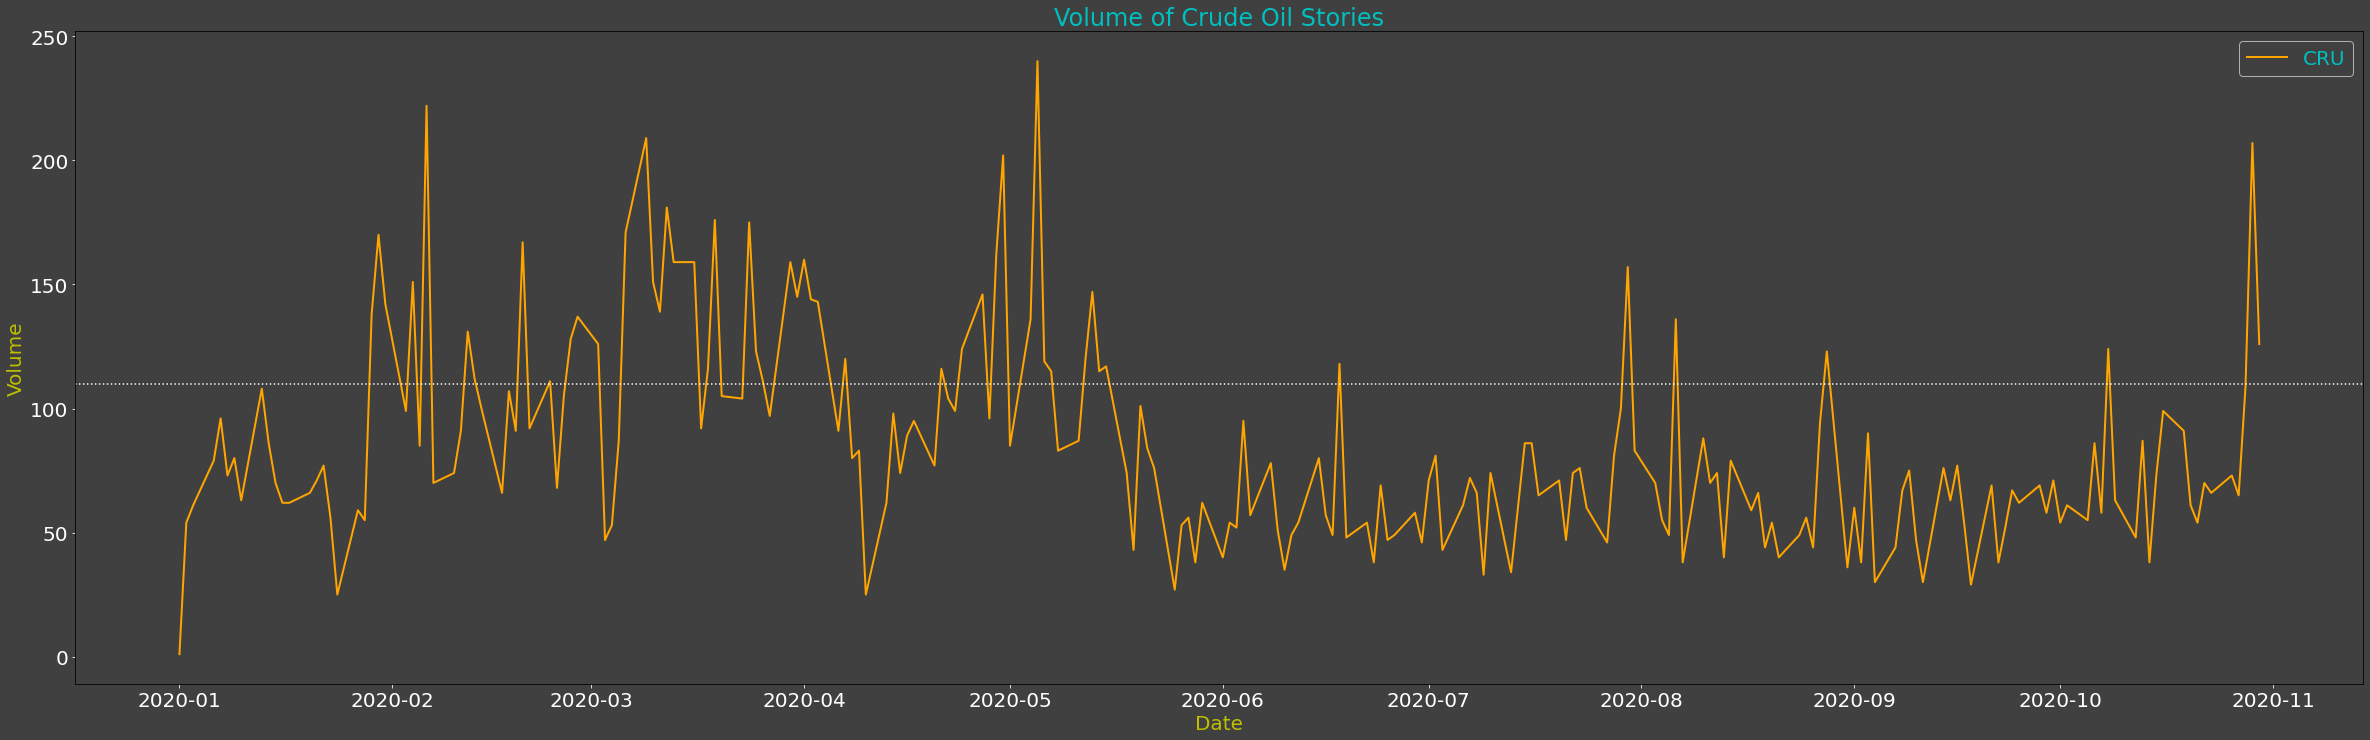
Notice the sustained high volume of Crude Oil relates stories (above 100) - from February / March to May and a big spike at the end of October.
Next, I fetched the Crude Oil Historical Prices for the same date range - this was obtained from our Historical Pricing data service using the RDP Library. You can see the code for this in the fetch_historical_data() function in my Crude Oil notebook.
As with the News Stories Volume data, I also dumped this price data into the XL file so that you could run the demo code without having access to the Historical Pricing service.
I also fetched the summed Positive and Negative Sentiment scores for the News Story volumes - which I used in a subsequent step (see later).
I then plotted the Historical Price for Crude oil in isolation - so we could observe the price movements:
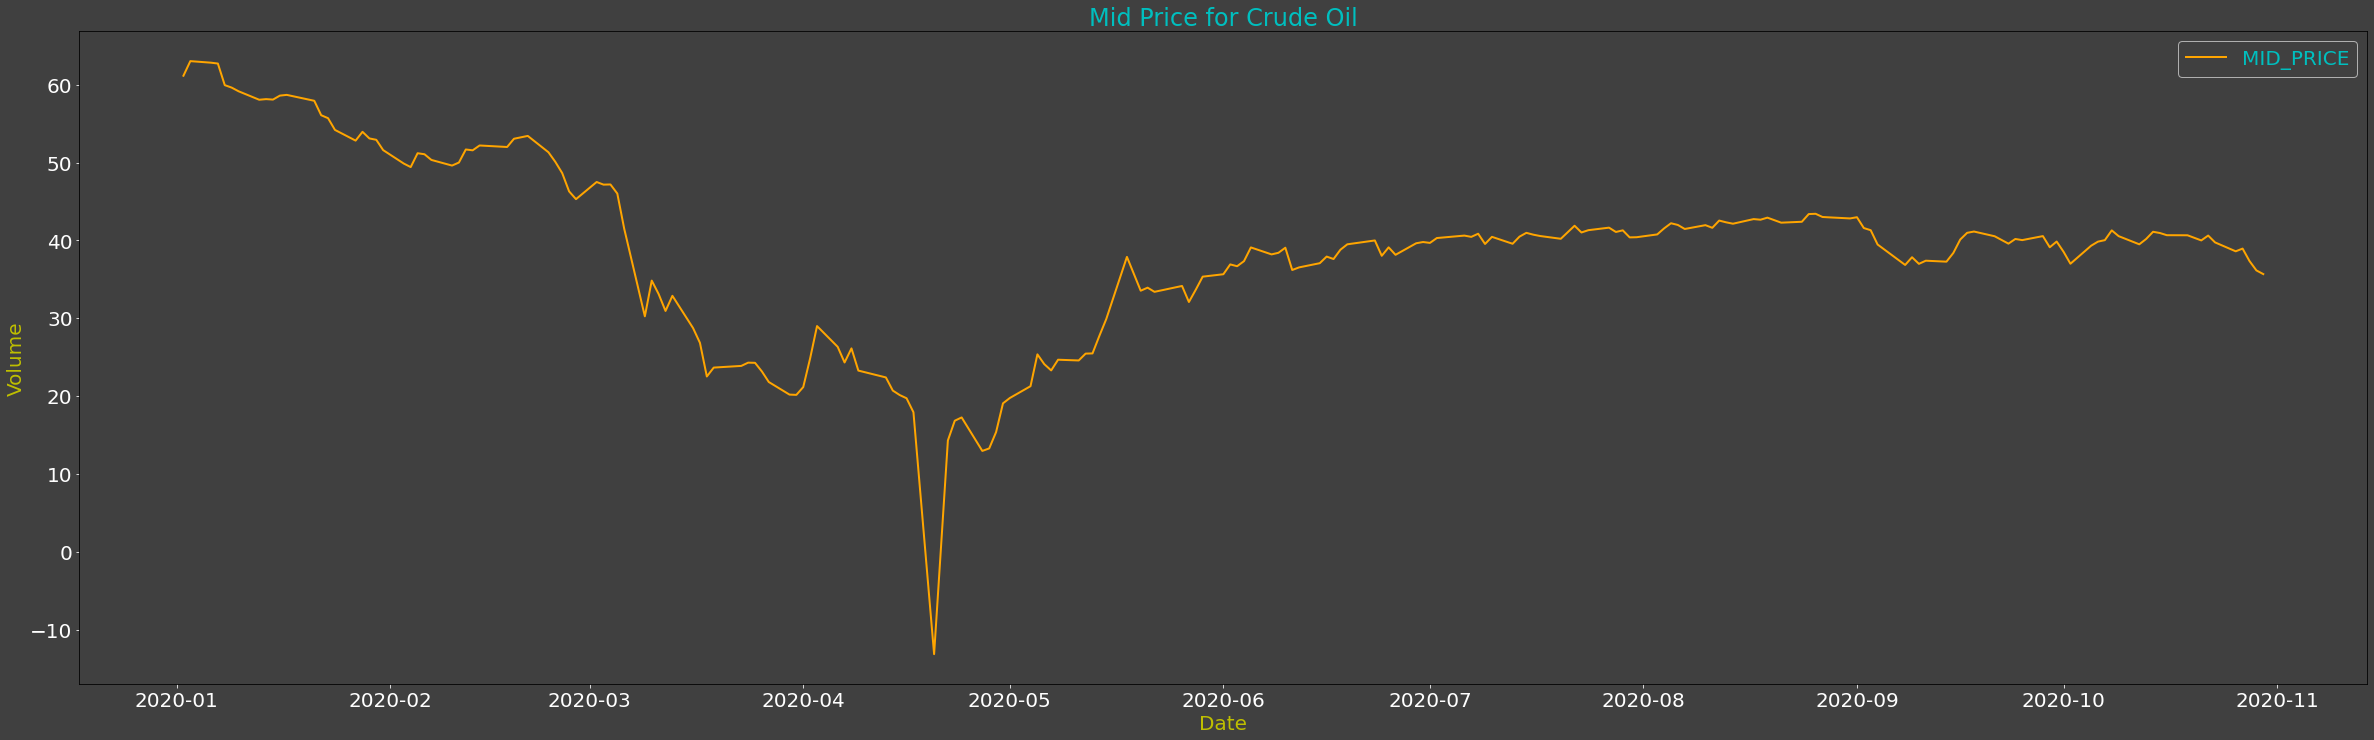
Notice the gradually declining price from late February to mid-April to around 20$ and then the sudden and short-lived drop into negative territory. This was followed by an equally fast recovery into positive and then a gradual recovery to around $40.
Overlay Volume of stories on the Price chart
For my next step, I overlaid the Volume of Stories onto the Price chart (with some price scale adjustment)
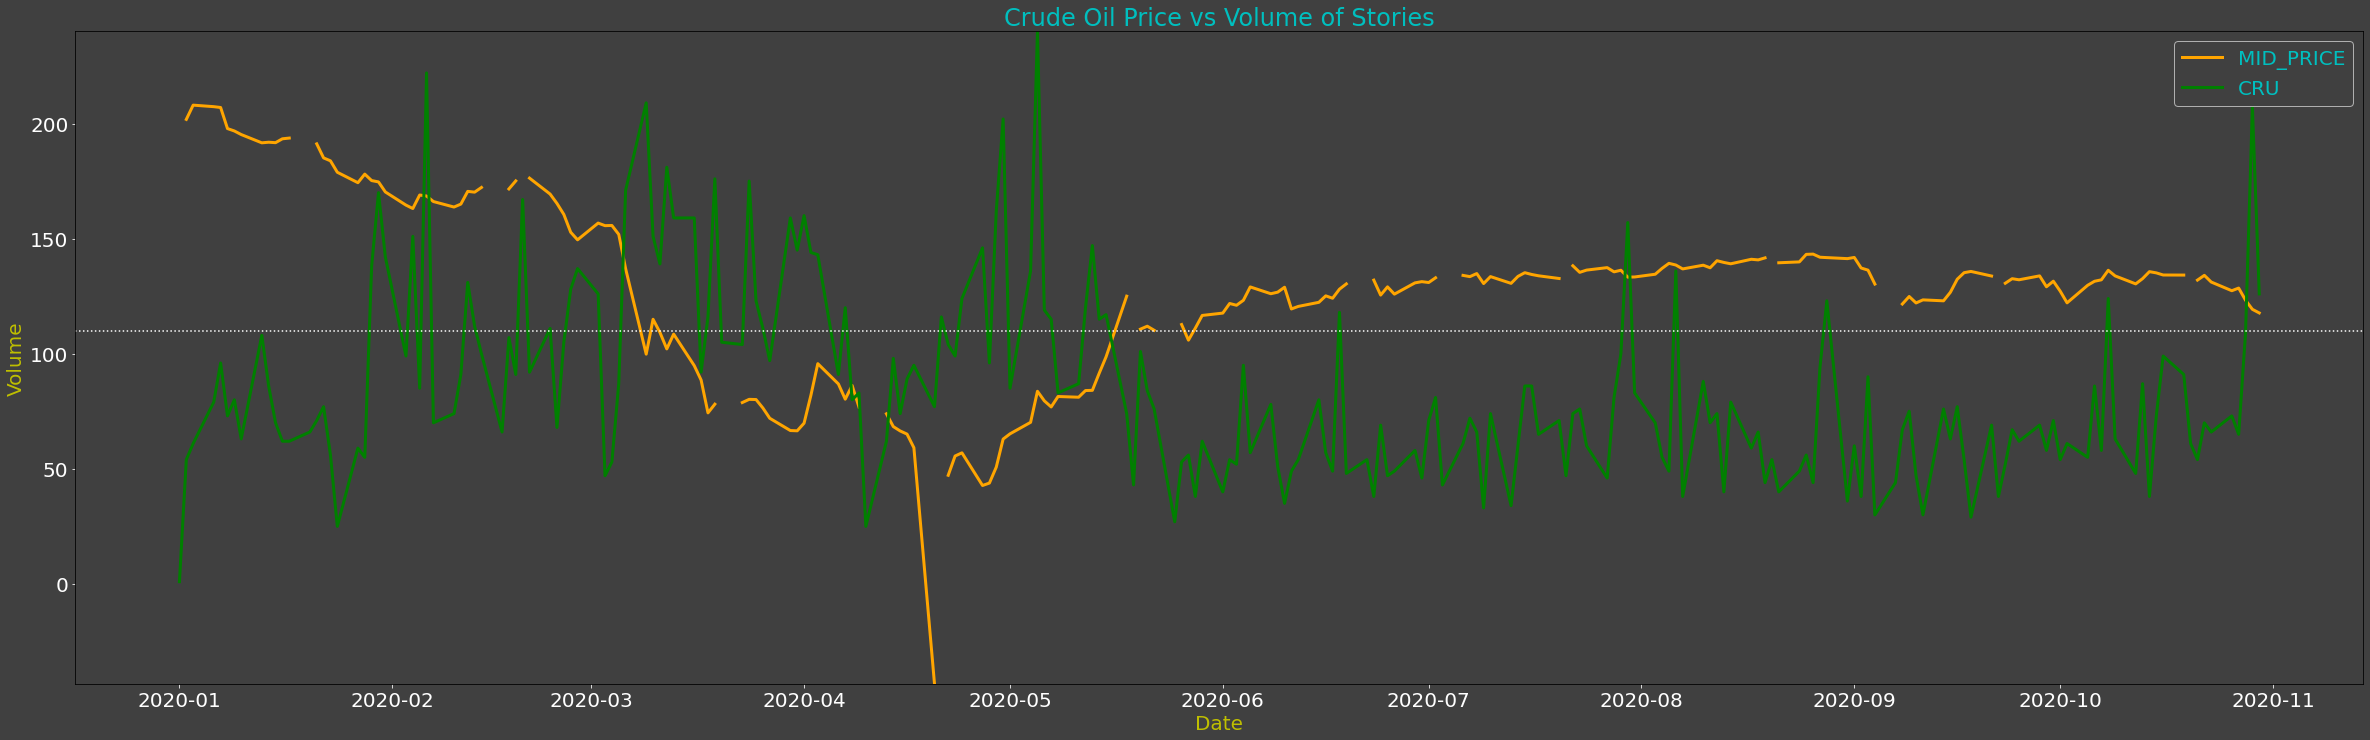
As you will see from the above graph, when we have an extended period of news coverage for Crude Oil, it seems to affect the price of related assets to a greater degree - compared to when we have a short-lived spike.
So, when we had a sustained high volume of Crude Oil relates stories from February to May we can see considerable movement in the price of Crude oil. However, we can see that some of the other short-lived spikes in August and November do not have anywhere near the same impact.
Can the Sentiment of the News Stories affect the price - Impact of Negative vs Positive?
This can be taken a step further by looking at the News Sentiment scores and relevance scores to further refine the results of any such analysis - e.g. does Negative Sentiment result in downward price movement and vice versa?
To explore this, I overlaid the -ve and +ve Sentiment scores over the Price:
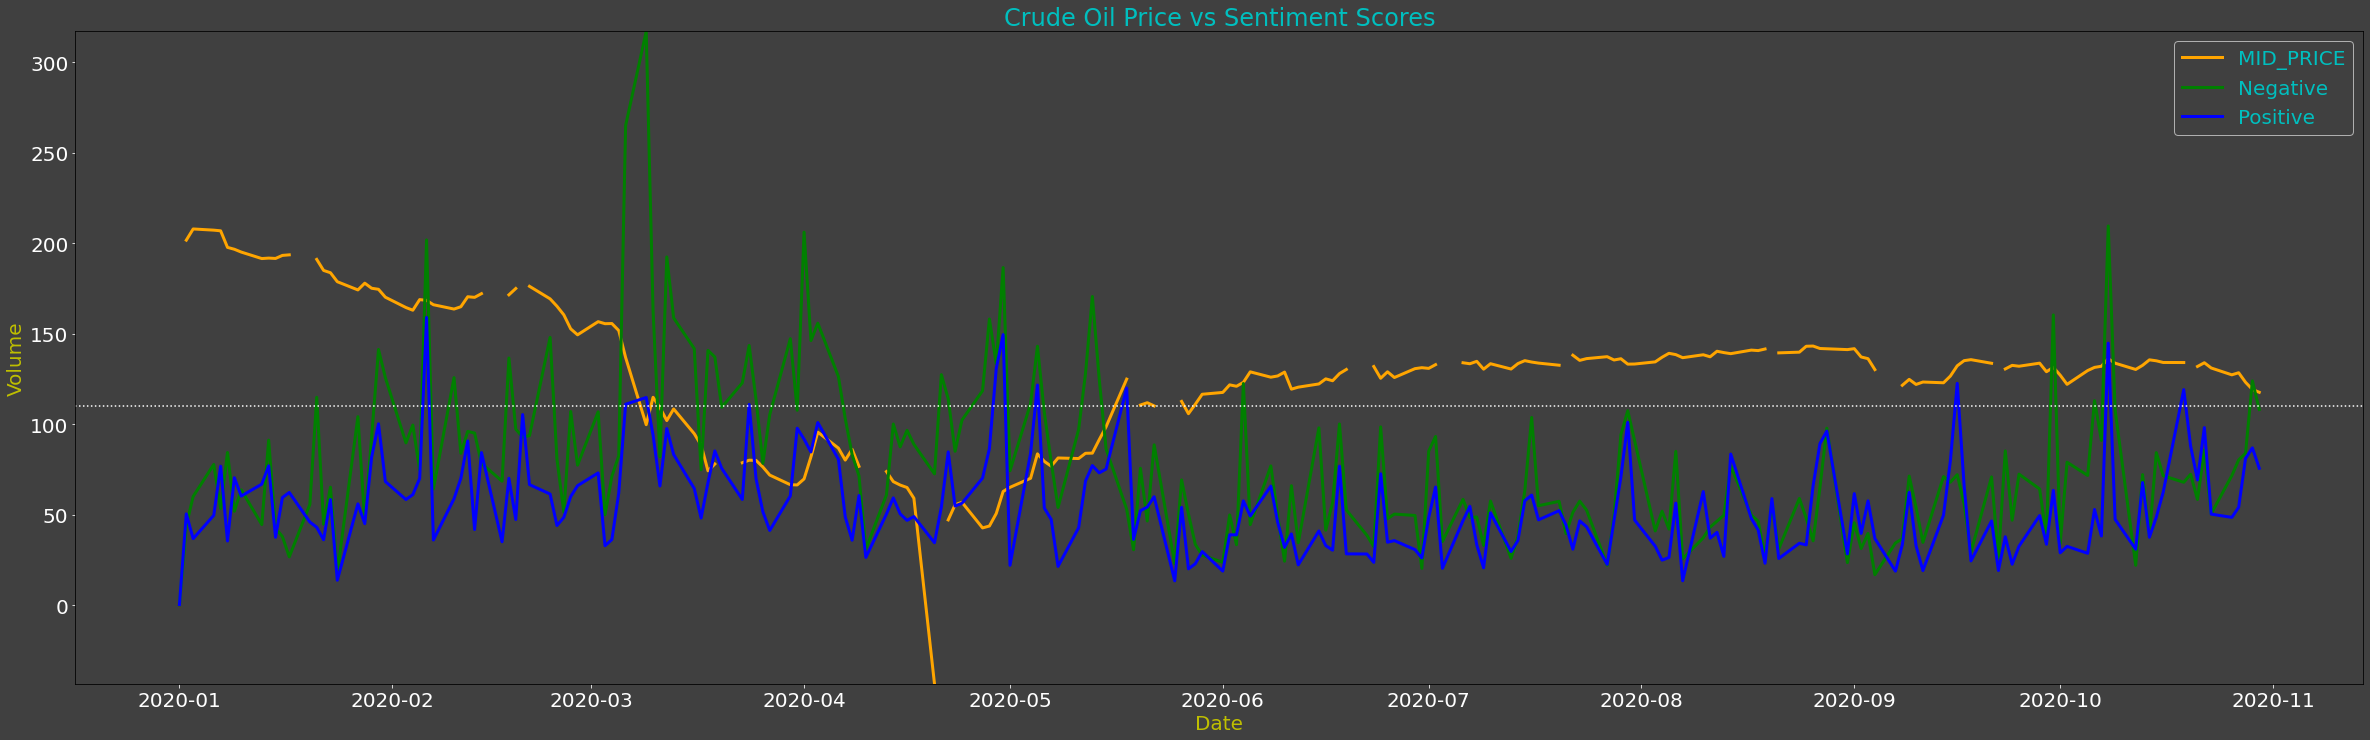
Between February and early May, we can see a consistently higher volume of Negative sentiment stories and this is reflected in a downward price movement.
As May progresses, the volume of Positive stories almost matches the negative - resulting in gradual upward price movement
There are several other instances where short-lived spikes in Positive or Negative stories are not necessarily reflected in an equivalent price movement
However, the overriding factor here appears to be the difference between Positive and Negative scoring stories:
- When we saw a similar level of Positive and Negative scoring stories, the price either stabilised or moved upwards
- When the number of Negative scoring stories was much higher, the price generally dropped
Based on the limited data above - we could also explore the idea that Positive spikes seem to have more of an impact on price than Negative spikes e.g. May and late September?
We could also introduce the Relevance score into the mix to help filter out noise - something which I will leave for you to perhaps explore further.
Closing Summary
So, does sustained news coverage over an extended period have a greater impact an assets price compared to short lived spikes in volume of news stories?
Our very basic exploration would suggest that there is certainly merit to this idea.
Furthermore, we also saw that the difference in sentiment score type also appears to affect the direction of any Price movement.
We can no doubt refine the basic ideas above further - including using the Relevance value of the stories to filter out noise.
You can find links to the Webinar and demo source code on the right hand panel at the start of this article.
I would like to thank my colleague Zoya Farberov for her efforts in transferring the Bulk Data files into the database and Amit Das for the insights covered in this article - Thank you both.