

This article continues the discussion of News Analytics that was started with News Analytics - Gelaning Insights webinar, presented by Refinitiv in January of 2021.
What We Are Going To Discuss
How do we glean insights from news sentiments?
- Sharp increase in the volume of news and the volume of rated news resulting in the captured news sentiments
- The impact of the moving average of positive or negative news sentiment, large spread between positive and negative news sentiment
Let us explore a couple of use cases together, while defining an implementation in Jupyter Python, that we will share with the readers:
- Read credentials from file
- Connect to MySQL database using credentials
- Retrieve all scores for Asset, example Deutsche
- Carnival Corp, 2020
- Retrieve Asset's scores and scatter plot Negative Sentiment for Asset by Date
- Line chart number of relevant ratings
- Line chart average sentiments of relevant rated stories By Date
- Chart Price History for the same time interval
- Saudi Oil, 2020
- Retrieve Asset's scores and scatter plot Negative Sentiment for Asset by Date
- Line chart number of relevant ratings
- Line chart average sentiments of relevant rated stories By Date
- Chart Price History for the same time interval
- Facebook, 2018
- Retrieve Asset's scores and scatter plot Negative Sentiment for Asset by Date
- Line chart number of relevant ratings
- Line chart average sentiments of relevant rated stories By Date
- Chart Price History for the same time interval
Tools and Assumptions
We have tested with:
- Python 3.8
- JupyterLab 2.2.6
- MySQL 8.0
- Refinitiv Workspace/ Eikon Desktop
Our MySQL database is already pre-setup with Refinitiv Machine Readable News History full set of news and news scores for years 2020 and 2018.

Please find, in the included references, an article News Sentiments History - Setting up in MySQL Database for Ease of Use, on how to go about creating, configuring and populating the pre-requisite My SQL database setup.
Read MySQL Credentials
Reading credentials from file is a convenient step, if the use case at hand requires providing valid credentials numerous times, repeatedly.
Alternatively, the credentials can be entered on the fly, read from the input, every time the notebook is executed, or even hard-coded, which is not very secure.
import requests, json, time, sys
credFile = open(".\creds\creds.txt","r") # one per line
#--- USER---
#--- PASSWORD---
USERNAME = credFile.readline().rstrip('\n')
PASSWORD = credFile.readline().rstrip('\n')
credFile.close()
# Make sure that creds are read in correctly
#print("USERNAME="+str(USERNAME))
#print("PASSWORD="+str(PASSWORD))
now we are ready to
Connect To MySQL Database
import mysql.connector
DATABASE='newsanalyticsdb'
myConn = ""
try:
myConn = mysql.connector.connect(
host="localhost",
user=USERNAME,
passwd=PASSWORD,
database=DATABASE
)
except mysql.connector.Error as err:
if err.errno == errorcode.ER_ACCESS_DENIED_ERROR:
print("Something is wrong with your user name or password")
elif err.errno == errorcode.ER_BAD_DB_ERROR:
print("Database does not exist")
else:
print(err)
else:
print("Connected to "+ DATABASE)
Define Retrieval By assetId
- Identify and capture the content fields of interest, to be consequently retrieved from the database tables News and in Scores
- Define a helper function to be used for retrieval
- Retrieve all scores for Deutsche
# intorduce fields to archive from news
newsArchivedFields = {
'id': 'VARCHAR(255)',
'feedTimestamp' : 'VARCHAR(255)',
'headline' : 'VARCHAR(520)', #max is 512 + ...
'subjects' : 'VARCHAR(10000)'}
# intorduce fields to archive from scores
scoresArchivedFields = {
'id': 'VARCHAR(255)',
'assetId': 'VARCHAR(255)',
'assetName': 'VARCHAR(255)',
'emeaTimestamp' : 'VARCHAR(255)',
'sentimentNegative' : 'DECIMAL(10,6)',
'sentimentNeutral' : 'DECIMAL(10,6)',
'sentimentPositive' : 'DECIMAL(10,6)',
'relevance' : 'DECIMAL(10,7)'}
def retrieveFromTable(tableName, assetId):
RETRIEVE_QUERY = 'SELECT * FROM ' + tableName + ' WHERE assetId=\''+ assetId + '\'';
try:
#Get cursor to db connection
myCursor = myConn.cursor(buffered=True)
myCursor.execute(RETRIEVE_QUERY)
rows = myCursor.fetchall()
print('Total Row(s):', myCursor.rowcount)
for row in rows:
print(row)
except Error as e:
print(e)
finally:
myCursor.close()
myConn.close()
retrieveFromTable('SCORES', 'P:4295869482')
should allow us to examine the contents of the database that are relevant to a specific organization, selecting them by assetId, that in this case is PermId.
('tr:ACN58442a_2004062eqcVXMfJrR5/BOEM0tJrPsJv3uVEmRCR+tX83', 'P:4295869482', 'Deutsche Bank AG', '2020-04-06T04:14:11.079Z', Decimal('0.062453'), Decimal('0.140947'), Decimal('0.796600'), Decimal('0.7071070'))
('tr:ASA00QVX__2005191wDLEwbkltyogSLJ1WMJVuZ8VPL7cxOiob8a/x', 'P:4295869482', 'Deutsche Bank AG', '2020-05-19T14:47:00.717Z', Decimal('0.028249'), Decimal('0.115890'), Decimal('0.855861'), Decimal('1.0000000'))
('tr:ASN0002TA_2002101FLytXUPx2oOW3yDtBPlXKZKr3Fe7+5YyDU9vI', 'P:4295869482', 'Deutsche Bank AG', '2020-02-10T16:59:50.083Z', Decimal('0.157619'), Decimal('0.614813'), Decimal('0.227568'), Decimal('1.0000000'))
('tr:ASN0002TA_2002101H6RMvI6Dsg24mo5KJhdo23nAwscqq/osnRYwb', 'P:4295869482', 'Deutsche Bank AG', '2020-02-10T17:00:11.401Z', Decimal('0.052306'), Decimal('0.190794'), Decimal('0.756900'), Decimal('1.0000000'))
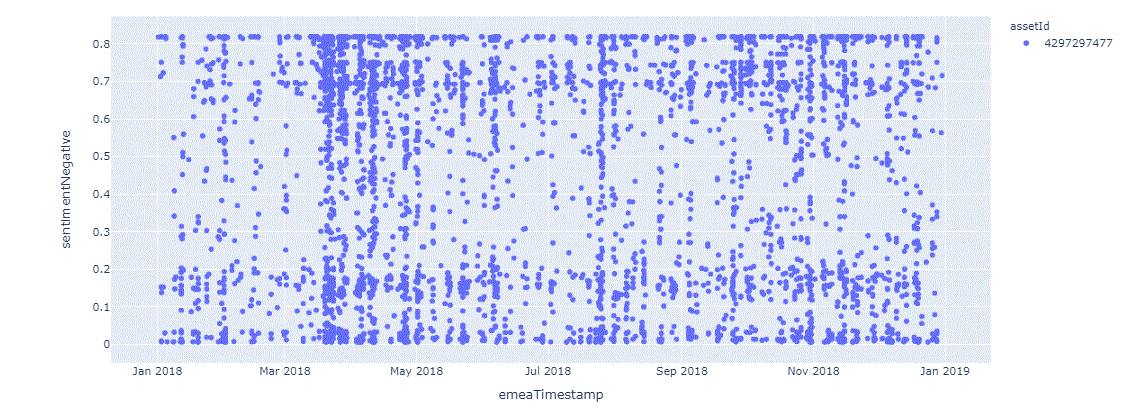
Retrieve Into DataFrame , ScatterPlot by Exact Date
We define helper functions retrieveIntoDataFrame and scatterPlotDf that will come handy for retrieving, examining and analyzing the archived content set
def retrieveIntoDataFrame(tableName, assetId, year, minRel):
MIN_RELEVANCE = str(minRel) #'0.75'
RETRIEVE_QUERY = 'SELECT * FROM ' + tableName + ' WHERE assetId=\''+ assetId + '\' AND relevance > '+ MIN_RELEVANCE+ 'AND emeaTimestamp LIKE \''+year+'%%\'';
db_connection_str = 'mysql+pymysql://'+USERNAME+':'+PASSWORD+'@localhost/'+DATABASE
db_connection = create_engine(db_connection_str)
df = pd.read_sql(RETRIEVE_QUERY, con=db_connection)
return df
def scatterPlotDf(df):
# pyof.init_notebook_mode(connected=False) #Notebook
fig = px.scatter(df, x='emeaTimestamp', y='sentimentNegative', color='assetId')
#fig.update_layout(autosize=False,
# margin=dict(l=20, r=20, t=20, b=20),
# paper_bgcolor="LightSteelBlue",
#)
fig.show(renderer='iframe')
Running the function on Carnival 2020 data set:
(note, how we only use the data points where relevance to the rated asset, Carnival, is greater then 3/4)
dfCarni = retrieveIntoDataFrame('SCORES', 'P:4295903693', '2020', 0.75)
scatterPlotDf(dfCarni)

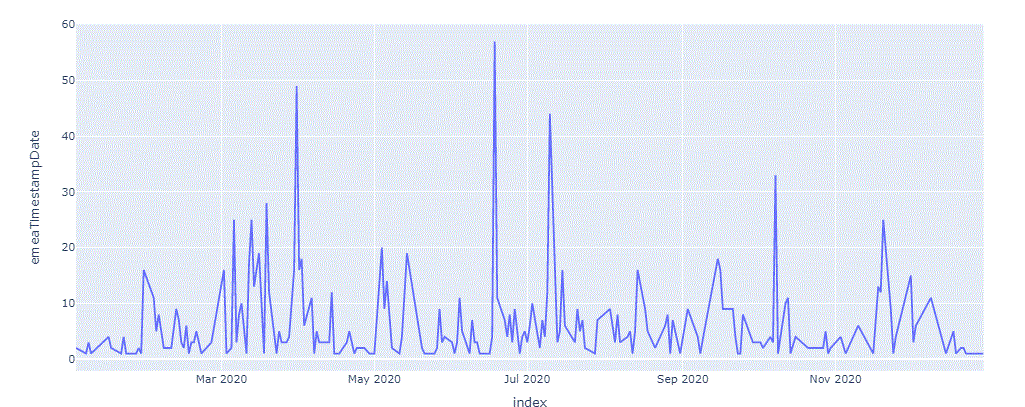
Line Chart Number of Rated Stories By Date
Let us define a helper function to observe the volume of rated stories peaks that correspond to the stock getting heavy news coverage
def lineChartVolRatedByDate(dfMine):
dfMine['emeaTimestampDate'] = dfMine['emeaTimestamp'].str[:10]
dfMine = dfMine['emeaTimestampDate'] .value_counts(sort = False).to_frame().sort_index().reset_index()
dfMine
fig = px.line(dfMine,x='index', y='emeaTimestampDate')
fig.show()
Run the function on data set Carnival Corp 2020.
lineChartVolRatedByDate(dfCarni)
Line Chart Sum of Ratings of Rated Stories By Date As Is
Defining a helper function lineChartAveByDateAsIs next:
- Not very clear in terms of the pattern
- However, on peaks we can tell which outweighs, negative or positive
def lineChartAveByDateAsIs(dfMine):
dfMine['emeaTimestampDate'] = dfMine['emeaTimestamp'].str[:10]
dfMine = dfMine.groupby(['emeaTimestampDate']).sum()
# print(dfMine)
fig3 = px.line(dfMine,x=dfMine.index, y=['sentimentNegative', 'sentimentPositive'])
fig3.show()
lineChartAveByDateAsIs(dfCarni)
Let us see how this works on the example of Carnival dataset for 2020:
Next, let us introduce
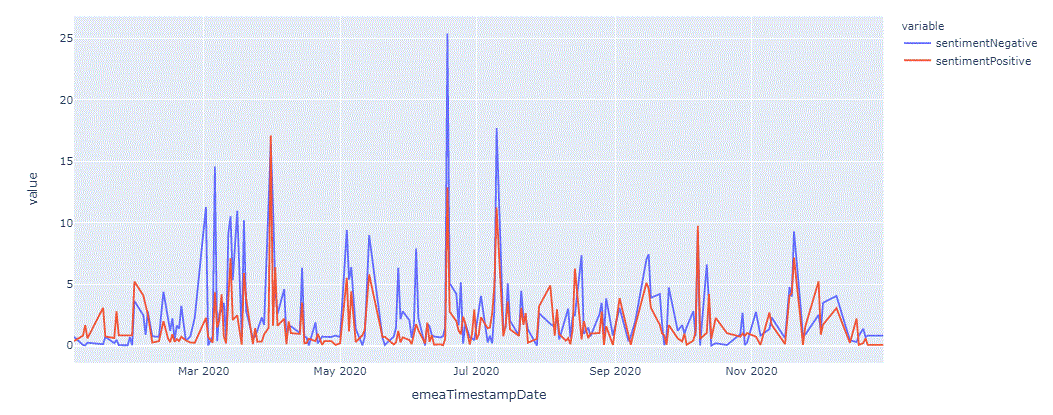
Line Chart Average Ratings of Rated Stories By Date Rolling
def lineChartAveByDate(dfMine):
dfMine['emeaTimestampDate'] = dfMine['emeaTimestamp'].str[:10]
dfMine = dfMine.groupby(['emeaTimestampDate']).mean()
dfMine['DifferencePositiveNeutral'] = dfMine.sentimentPositive - dfMine.sentimentNeutral
dfMine['DifferenceNeutralNegative'] = dfMine.sentimentNeutral - dfMine.sentimentNegative
dfMine['SpreadPositiveNegative'] = dfMine.sentimentPositive - dfMine.sentimentNegative
dfMine['sentimentNegativeRollingMean'] = dfMine.sentimentNegative.rolling(10).mean()
dfMine['sentimentPositiveRollingMean'] = dfMine.sentimentPositive.rolling(10).mean()
dfMine['SpreadPositiveNegativeRollingMean'] = dfMine.SpreadPositiveNegative.rolling(10).mean()
# print(dfMine)
fig3 = px.line(dfMine,x=dfMine.index, y=['sentimentNegativeRollingMean', 'sentimentPositiveRollingMean','SpreadPositiveNegativeRollingMean'])
fig3.show()
Going back to Carnival 2020 data set, patterns that emerge seem more clear:

Usually, the patterns of particular interest are
- Sustained sharp increase or decrease in sentiment average
- Points where SentimentNegativeRollingMean line crosses with SentimentPositiveRollingMean line
Now we are ready to
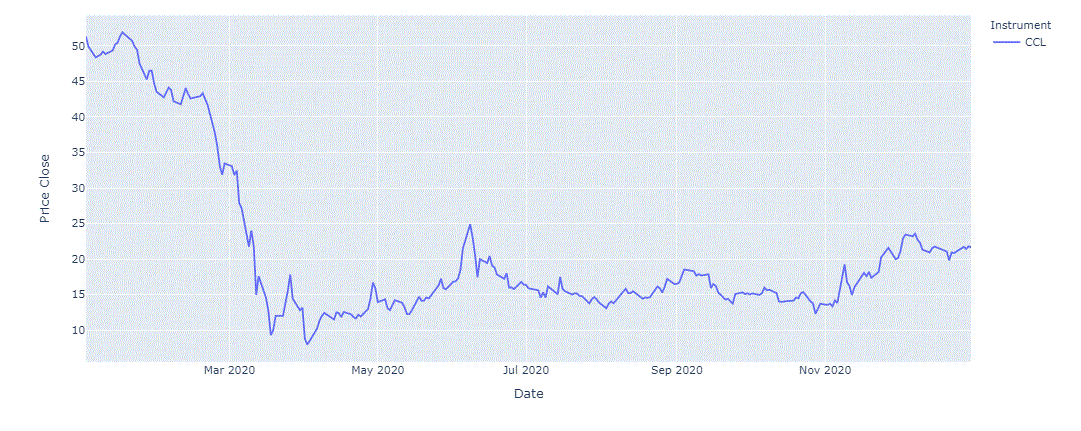
Chart Price History via Eikon Data API
There are several implementation options that allow to obtain price history programmatically, this specific option was just selected for a quick implementation in this specific case.
import eikon as ek
ek.set_app_key('8a0a51d096f34eec86dadab1763ad94dae81c80e')
dfD, err = ek.get_data('CCL',['TR.PriceClose.date','TR.PriceClose'],{'SDate':'2020-01-01', 'EDate':'2020-12-31'})
#print(dfD)
fig = px.line(dfD, x='Date', y='Price Close', color='Instrument')
fig.show()
Next, we run it on Carnival Corp, 2020, and observe:
It seems that Feb 18th is a key point, News Sentiment falls sharply from late January till Feb 18th, and that's when closing price begin to fall sharply
Gleaning Insights - Let's Hear from the Experts
The previous chart with rolling averages shows a lot about, and sentiments in news story shows how the company or the asset is being viewed. The most stark aspect that we should be looking at is how positive and negative sentiment changes. We see in mid-February how positive sentiment is going down and negative sentiment is going up, and they cross over. With that net negative sentiment, through the beginning of March is taking a big dip, that leads to a big dip in the price points.
Now that the helper functions are defined, we can use the same approach to examine the content set for any asset that is part of our database. Let us take a look at the same charts for Facebook in 2018.
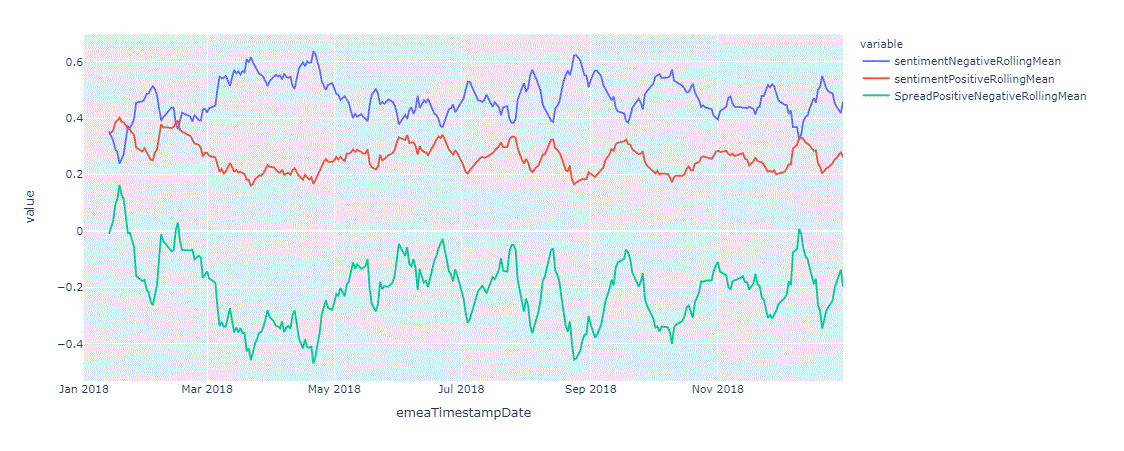

Gleaning Insights - What Should We Notice
As we see with this, and on other cases before also, when changes to sentiments happen, be it from positive to negative or from negative to positive that crossover is important, the additional piece here,to think about, and to know, is how volume counts into this. When sentiment takes a quick spike, that often does not lead to a sustained price change. The price can change for a day, or two, maybe a week, but then it goes back to where it was before. But if we see a sentiment change, along with a huge increase in a volume of news, that shows a significance of this event, and often results in a sustained price movement for a much longer period of time.
References
Cheerful thanks go to Amit Das, our subject matter expert, for generously sharing his knowledge and time with us.
naRetrieveChart.ipynb example on GitHub
In the companion Jupyter book example, find included:
- Carnival Corp, 2020
- Saudi Oil, 2020
- Facebook, 2018
Examples.RDPLibrary.Python.NewsAnalyticsWebinar2021 on GitHub - all the examples from News Analytics - Gelaning Insights webinar