

This article will demonstrate how we can conduct a simple sentiment analysis of news delivered via our new Eikon Data APIs. Natural Language Processing (NLP) is a big area of interest for those looking to gain insight and new sources of value from the vast quantities of unstructured data out there. The area is quite complex and there are many resources online that can help you familiarise yourself with this very interesting area. There are also many different packages that can help you as well as many different approaches to this problem. Whilst these are beyond the scope of this article - I will go through a simple implementation which will give you a swift enough introduction and practical codebase for further exploration and learning.
Pre-requisites:
Refinitiv Eikon / Workspace with access to new Eikon Data APIs
Python 2.x/3.x
Required Python Packages: eikon, pandas, numpy, beautifulsoup, textblob, datetime
Required corpora download: >>>python -m textblob.download_corpora (this is required by the sentiment engine to generate sentiment)
Introduction
NLP is a field which enables computers to understand human language (voice or text). This is quite a big area of research and a little enquiry on your part will furnish you with the complexities of this problem set. Here we will be focussing on one application of this called Sentiment Analysis. In our case we will be taking news articles(unstructured text) for a particular company, IBM, and we will attempt to grade this news to see how postive, negative or neutral it is. We will then try to see if this news has had an impact on the shareprice of IBM.
To do this really well is a non-trivial task, and most universtities and financial companies will have departments and teams looking at this. We ourselves provide machine readable news products with News Analytics (such as sentiment) over our Refinitiv Real-Time platform in realtime at very low latency - these products are essentially consumed by algorithmic applications as opposed to humans.
We will try to do a similar thing as simply as possible to illustrate the key elements - our task is significantly eased by not having to do this in a low latency environment. We will be abstracting most of the complexities to do with the mechanics of actually analysing the text to various packages. You can then easily replace the modules such as the sentiment engine etc to improve your results as your understanding increases.
So lets get started. First lets load the packages that we will need to use and set our app_id.
In [1]:
import eikon as ek
import pandas as pd
import numpy as np
from bs4 import BeautifulSoup
from textblob import TextBlob
import datetime
from datetime import time
import warnings
warnings.filterwarnings("ignore")
ek.set_app_key('YOUR APP KEY HERE')
There are two API calls for news:
get_news_headlines : returns a list of news headlines satisfying a query
get_news_story : returns a HTML representation of the full news article
We will need to use both - thankfully they are really straightforward to use. We will need to use get_news_headlines API call to request a list of headlines. The first parameter for this call is a query. You dont really need to know this query language as you can generate it using the News Monitor App (type NEWS into Eikon search bar) in Eikon.
You can see here I have just typed in 2 search terms, IBM, for the company, and, English, for the language I am interested in (in our example we will only be able to analyse English language text - though there are corpora, packages, methods you can employ to target other languages - though these are beyond the scope of this article). You can of course use any search terms you wish.
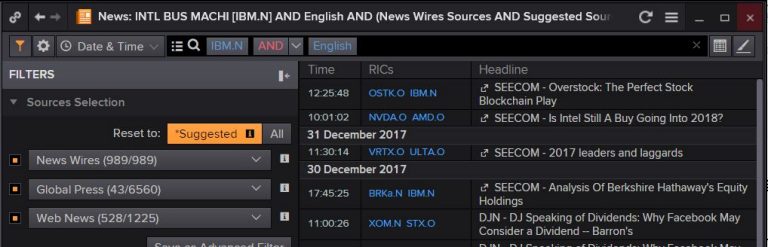
After you have typed in what you want to search for - we can simply click in the search box and this will then generate the query text which we can then copy and paste into the API call below. Its easy for us to change logical operations such as AND to OR, NOT to suit our query.
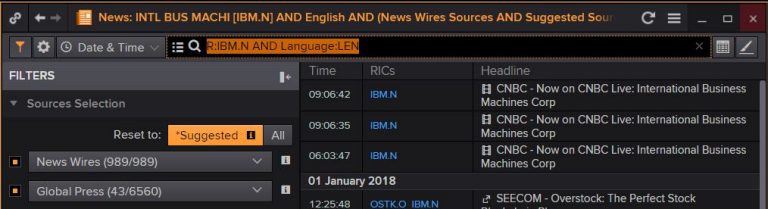
So the line of code below gets us 100 news headlines for IBM in english prior to 4th Dec 2017, and stores them in a dataframe, df for us.
In [2]:
df = ek.get_news_headlines('R:IBM.N AND Language:LEN', date_to = "2017-12-04", count=100)
df.head()
Out[2]:
| versionCreated | text | storyId | sourceCode | |
|---|---|---|---|---|
| 2017-12-01 23:11:47.374 | 2017-12-01 23:11:47.374 | Reuters Insider - FM Final Trade: HAL, TWTR & ... | urn:newsml:reuters.com:20171201:nRTV8KBb1N:1 | NS:CNBC |
| 2017-12-01 19:19:20.279 | 2017-12-01 19:19:20.279 | IBM ST: the upside prevails as long as 150.2 i... | urn:newsml:reuters.com:20171201:nGUR2R6xQ:1 | NS:GURU |
| 2017-12-01 18:12:41.143 | 2017-12-01 18:12:41.143 | INTERNATIONAL BUSINESS MACHINES CORP SEC Filin... | urn:newsml:reuters.com:20171201:nEOL6JJfRT:1 | NS:EDG |
| 2017-12-01 18:12:41.019 | 2017-12-01 18:12:41.019 | INTERNATIONAL BUSINESS MACHINES CORP SEC Filin... | urn:newsml:reuters.com:20171201:nEOL3YHcVY:1 | NS:EDG |
| 2017-12-01 18:06:03.633 | 2017-12-01 18:06:03.633 | Moody's Affirms Seven Classes of GSMS 2016-GS4 | urn:newsml:reuters.com:20171201:nMDY7wGNTP:1 | NS:RTRS |
I will just add 3 new columns which we will need to store some variables in later.
In [3]:
df['Polarity'] = np.nan
df['Subjectivity'] = np.nan
df['Score'] = np.nan
So we have our frame with the most recent 100 news headline items. The headline is stored in the text column and the storyID which we will now use to pull down the actual articles themselves, is stored in the storyID column.
We will now iterate through the headline dataframe and pull down the news articles using the second of our news API calls, get_news_story. We simply pass the storyID to this API call and we are returned a HTML representation of the article - which allows you to render them nicely etc - however for our purposes we want to strip the HTML tags etc out and just be left with the plain text - as we dont want to analyse HTML tags for sentiment. We will do this using the excellent BeautifulSoup package.
Once we have the text of these articles we can pass them to our sentiment engine which will give us a sentiment score for each article. So what is our sentiment engine? We will be using the simple TextBlob package to demo a rudimentary process to show you how things work. TextBlob is a higher level abstraction package that sits on top of NLTK (Natural Language Toolkit) which is a widely used package for this type of task.
NLTK is quite a complex package which gives you a lot of control over the whole analytical process - but the cost of that is complexity and required knowledge of the steps invloved. TextBlob shields us from this complexity, but we should at some stage understand what is going on under the hood. Thankfully there is plenty of information to guide us in this. We will be implementing the default PatternAnalyzer which is based on the popular Pattern library though there is also a NaiveBayesAnalyzer which is a NLTK classifier based on a movie review corpus.
All of this can be achieved in just a few lines of code. This is quite a dense codeblock - so I have commented the key steps.
In [4]:
for idx, storyId in enumerate(df['storyId'].values): #for each row in our df dataframe
newsText = ek.get_news_story(storyId) #get the news story
if newsText:
soup = BeautifulSoup(newsText,"lxml") #create a BeautifulSoup object from our HTML news article
sentA = TextBlob(soup.get_text()) #pass the text only article to TextBlob to anaylse
df['Polarity'].iloc[idx] = sentA.sentiment.polarity #write sentiment polarity back to df
df['Subjectivity'].iloc[idx] = sentA.sentiment.subjectivity #write sentiment subjectivity score back to df
if sentA.sentiment.polarity >= 0.05: # attribute bucket to sentiment polartiy
score = 'positive'
elif -.05 < sentA.sentiment.polarity < 0.05:
score = 'neutral'
else:
score = 'negative'
df['Score'].iloc[idx] = score #write score back to df
df.head()
Out[4]:
| versionCreated | text | storyId | sourceCode | Polarity | Subjectivity | Score | |
|---|---|---|---|---|---|---|---|
| 2017-12-01 23:11:47.374 | 2017-12-01 23:11:47.374 | Reuters Insider - FM Final Trade: HAL, TWTR & ... | urn:newsml:reuters.com:20171201:nRTV8KBb1N:1 | NS:CNBC | 0.066667 | 0.566667 | positive |
| 017-12-01 19:19:20.279 | 2017-12-01 19:19:20.279 | IBM ST: the upside prevails as long as 150.2 i... | urn:newsml:reuters.com:20171201:nGUR2R6xQ:1 | NS:GURU | 0.055260 | 0.320844 | positive |
| 2017-12-01 18:12:41.143 | 2017-12-01 18:12:41.143 | INTERNATIONAL BUSINESS MACHINES CORP SEC Filin... | urn:newsml:reuters.com:20171201:nEOL6JJfRT:1 | NS:EDG | 0.000000 | 0.000000 | neutral |
| 2017-12-01 18:12:41.019 | 2017-12-01 18:12:41.019 | INTERNATIONAL BUSINESS MACHINES CORP SEC Filin... | urn:newsml:reuters.com:20171201:nEOL3YHcVY:1 | NS:EDG | 0.000000 | 0.000000 | neutral |
| 2017-12-01 18:06:03.633 | 2017-12-01 18:06:03.633 | Moody's Affirms Seven Classes of GSMS 2016-GS4 | urn:newsml:reuters.com:20171201:nMDY7wGNTP:1 | NS:RTRS | 0.175000 | 0.325000 | positive |
Looking at our dataframe we can now see 3 new columns on the right, Polarity, Subjectivity and Score. As we have seen Polarity is the actual sentiment polarity returned from TextBlob (ranging from -1(negative) to +1(positive), Subjectivity is a measure (ranging from 0 to 1) where 0 is very objective and 1 is very subjective, and Score is simply a Positive, Negative or Neutral rating based on the strength of the polarities.
We would now like to see what, if any, impact this news has had on the shareprice of IBM. There are many ways of doing this - but to make things simple, I would like to see what the average return is at various points in time AFTER the news has broken. I want to check if there are aggregate differences in the average returns from the Positive, Neutral and Negative buckets we created earlier.
In [5]:
start = df['versionCreated'].min().replace(hour=0,minute=0,second=0,microsecond=0).strftime('%Y/%m/%d')
end = df['versionCreated'].max().replace(hour=0,minute=0,second=0,microsecond=0).strftime('%Y/%m/%d')
Minute = ek.get_timeseries(["IBM.N"], start_date=start, interval="minute")
Minute.tail()
Out[5]:
| IBM.N | HIGH | LOW | OPEN | CLOSE | COUNT | VOLUME |
|---|---|---|---|---|---|---|
| Date | ||||||
| 2018-01-05 15:21:00 | 162.32 | 162.18 | 162.22 | 162.31 | 23.0 | 3073.0 |
| 2018-01-05 15:22:00 | 162.42 | 162.29 | 162.31 | 162.42 | 23.0 | 2442.0 |
| 2018-01-05 15:23:00 | 162.46 | 162.43 | 162.45 | 162.46 | 11.0 | 960.0 |
| 2018-01-05 15:24:00 | 162.46 | 162.40 | 162.46 | 162.40 | 5.0 | 505.0 |
| 2018-01-05 15:25:00 | 162.39 | 162.31 | 162.36 | 162.33 | 12.0 | 1060.0 |
We will need to create some new columns for the next part of this analysis.
In [6]:
df['twoM'] = np.nan
df['fiveM'] = np.nan
df['tenM'] = np.nan
df['thirtyM'] = np.nan
df.head(2)
Out[6]:
| ersionCreated | text | storyId | sourceCode | Polarity | Subjectivity | Score | twoM | fiveM | tenM | thirtyM | |
|---|---|---|---|---|---|---|---|---|---|---|---|
| 2017-12-01 23:11:47.374 | 2017-12-01 23:11:47.374 | Reuters Insider - FM Final Trade: HAL, TWTR & ... | urn:newsml:reuters.com:20171201:nRTV8KBb1N:1 | NS:CNBC | 0.066667 | 0.566667 | positive | NaN | NaN | NaN | NaN |
| 2017-12-01 19:19:20.279 | 2017-12-01 19:19:20.279 | IBM ST: the upside prevails as long as 150.2 i... | urn:newsml:reuters.com:20171201:nGUR2R6xQ:1 | NS:GURU | 0.055260 | 0.320844 | positive | NaN | NaN | NaN | NaN |
OK so I now just need to get the timestamp of each news item, truncate it to minute data (ie remove second and microsecond components) and get the base shareprice of IBM at that time, and at several itervals after that time, in our case t+2 mins,t+5 mins, t+10 mins, t+30 mins, calculating the % change for each interval.
An important point to bear in mind here is that news can be generated at anytime - 24 hours a day - outside of normal market hours. So for news generated outside normal market hours for IBM in our case, we would have to wait until the next market opening to conduct our calculations. Of course there are a number of issues here concerning our ability to attribute price movement to our news item in isolation (basically we cannot). That said, there might be other ways of doing this - for example looking at GDRs/ADRs or surrogates etc - these are beyond the scope of this introductory article. In our example, these news items are simply discarded.
We will now loop through each news item in the dataframe, calculate (where possible) and store the derived performance numbers in the columns we created earlier: twoM...thirtyM.
In [7]:
for idx, newsDate in enumerate(df['versionCreated'].values):
sTime = df['versionCreated'][idx]
sTime = sTime.replace(second=0,microsecond=0,tzinfo=None)
try:
t0 = Minute['CLOSE'].iloc[Minute.index.get_loc(sTime)]
df['twoM'][idx] = ((Minute['CLOSE'].iloc[Minute.index.get_loc((sTime + datetime.timedelta(minutes=2)))]/(t0)-1)*100)
df['fiveM'][idx] = ((Minute['CLOSE'].iloc[Minute.index.get_loc((sTime + datetime.timedelta(minutes=5)))]/(t0)-1)*100)
df['tenM'][idx] = ((Minute['CLOSE'].iloc[Minute.index.get_loc((sTime + datetime.timedelta(minutes=10)))]/(t0)-1)*100)
df['thirtyM'][idx] = ((Minute['CLOSE'].iloc[Minute.index.get_loc((sTime + datetime.timedelta(minutes=30)))]/(t0)-1)*100)
#print(str(sTime)+" pass" + str(((Minute['CLOSE'].iloc[Minute.index.get_loc((sTime + datetime.timedelta(minutes=2)))]/(t0)-1)*100)))
except:
#print(str(sTime) + " fail" )
pass
df.head()
Out[7]:
| versionCreated | text | storyId | sourceCode | Polarity | Subjectivity | Score | twoM | fiveM | tenM | thirtyM | |
|---|---|---|---|---|---|---|---|---|---|---|---|
| 2017-12-01 23:11:47.374 | 2017-12-01 23:11:47.374 | Reuters Insider - FM Final Trade: HAL, TWTR & ... | urn:newsml:reuters.com:20171201:nRTV8KBb1N:1 | NS:CNBC | 0.066667 | 0.566667 | positive | NaN | NaN | NaN | NaN |
| 2017-12-01 19:19:20.279 | 2017-12-01 19:19:20.279 | IBM ST: the upside prevails as long as 150.2 i... | urn:newsml:reuters.com:20171201:nGUR2R6xQ:1 | NS:GURU | 0.055260 | 0.320844 | positive | 0.071119 | 0.084050 | 0.000000 | -0.109911 |
| 2017-12-01 18:12:41.143 | 2017-12-01 18:12:41.143 | INTERNATIONAL BUSINESS MACHINES CORP SEC Filin... | urn:newsml:reuters.com:20171201:nEOL6JJfRT:1 | NS:EDG | 0.000000 | 0.000000 | neutral | 0.012944 | -0.090609 | -0.032360 | 0.148858 |
| 2017-12-01 18:12:41.019 | 2017-12-01 18:12:41.019 | INTERNATIONAL BUSINESS MACHINES CORP SEC Filin... | urn:newsml:reuters.com:20171201:nEOL3YHcVY:1 | NS:EDG | 0.000000 | 0.000000 | neutral | 0.012944 | -0.090609 | -0.032360 | 0.148858 |
| 2017-12-01 18:06:03.633 | 2017-12-01 18:06:03.633 | Moody's Affirms Seven Classes of GSMS 2016-GS4 | urn:newsml:reuters.com:20171201:nMDY7wGNTP:1 | NS:RTRS | 0.175000 | 0.325000 | positive | 0.097238 | 0.155581 | 0.097238 | 0.246337 |
Fantastic - we have now completed the analytical part of our study. Finally, we just need to aggregate our results by Score bucket in order to draw some conclusions.
In [8]:
grouped = df.groupby(['Score']).mean() grouped
Out[8]:
| Polarity | Subjectivity | twoM | fiveM | tenM | thirtyM | |
|---|---|---|---|---|---|---|
| Score | ||||||
| negative | -0.146508 | 0.316746 | NaN | NaN | NaN | NaN |
| neutral | 0.006436 | 0.175766 | -0.004829 | -0.009502 | 0.028979 | 0.137544 |
| positive | 0.129260 | 0.406868 | 0.012089 | 0.012776 | 0.035936 | 0.047345 |
Observations
From our initial results - it would appear that there might be some small directional differences in returns between the positive and neutral groups over shorter time frames (twoM and fiveM) after news broke. This is a pretty good basis for further investigation. So where could we go from here?
We have a relatively small n here so we might want to increase the size of the study.
We might also want to try to seperate out more positive or negative news - ie change the threshold of the buckets to try to identify more prominent sentiment articles - maybe that could have more of an impact on performance.
In terms of capturing news impact - we have thrown a lot of news articles out as they happened outside of market hours - as it is more complex to ascertain impact - we might try to find a way of including some of this in our analysis - I mentioned looking at overseas listings GDR/ADRs or surrogates above. Alternatively, we could using EXACTLY the same process looking at all news for an index future - say the S&P500 emini - as this trades on Globex pretty much round the clock - so we would be throwing out a lot less of the news articles? Great I hear you cry - but would each news article be able to influence a whole index? Are index futures more sensitive to some types of articles than others? Is there a temporal element to this? These are all excellent questions. Or what about cryptocrurrencies? They trade 24/7? and so on.
We could also investigate what is going on with our sentiment engine. We might be able to generate more meaningful results by tinkering with the underlyng processes and parameters. Using a different, more domain-specific corpora might help us to generate more relevant scores.
You will see there is plenty of scope to get much more involved here.
This article was intended as an introduction to this most interesting of areas. I hope to have de-mystified this area for you somewhat and shown how it is possible to get started with this type of complex analysis using only a few lines of code, a simple easy to use yet powerfull API and some really fantastic packages, to generate some meaningful results.