


Last Updated: November 2023
With the rise of Data Scientists, Financial coders or Traders (aka Citizen Developers), and the rapid growth of Jupyter application, the main target of every Citizen Developer is replacing Microsoft Excel with the Jupyter application (reference: Jupyter is the new Excel).
However, Excel is not obsolete and is still an important file-format/application for businesses. It is easy to distribute, and non-IT people (especially your boss) can open it easily rather than having to set up the Jupyter/Python environment.
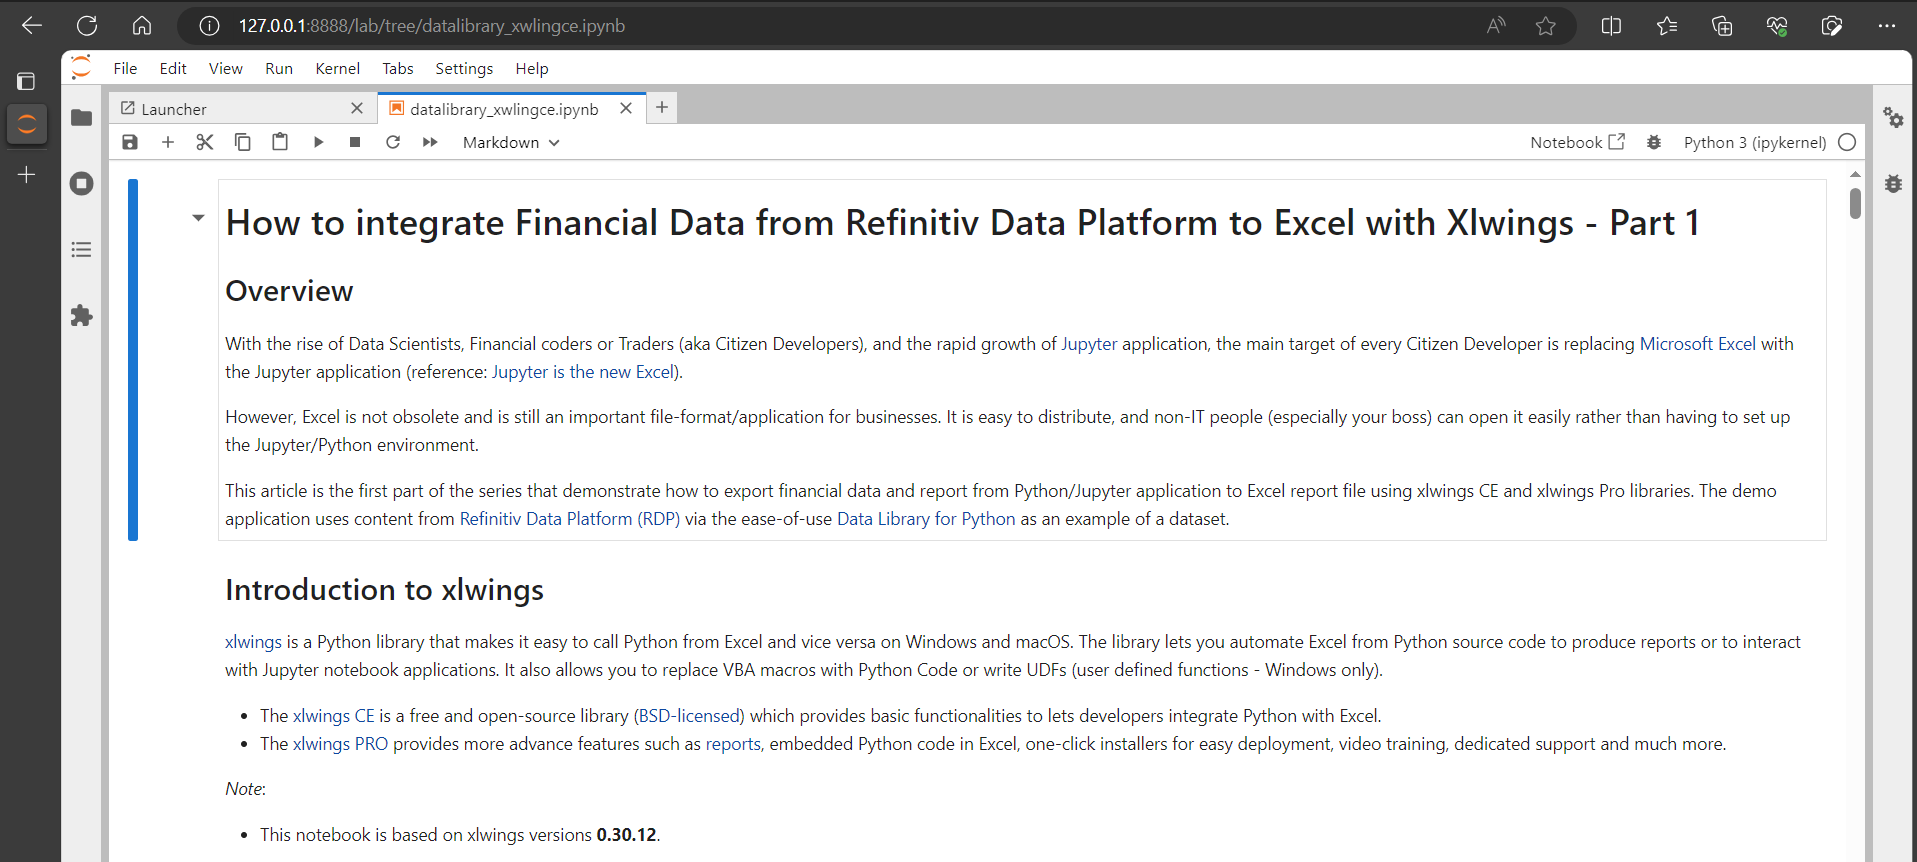
This article is the first part of the series that demonstrate how to export financial data and report from Python/Jupyter application to Excel report file using xlwings CE and xlwings Pro libraries. The demo application uses content from Refinitiv Data Platform (RDP) via the ease-of-use Data Library for Python as an example of a dataset.
Introduction to xlwings
xlwings is a Python library that makes it easy to call Python from Excel and vice versa on Windows and macOS. The library lets you automate Excel from Python source code to produce reports or to interact with Jupyter notebook applications. It also allows you to replace VBA macros with Python Code or write UDFs (user defined functions - Windows only).
- The xlwings CE is a free and open-source library (BSD-licensed) which provides basic functionalities to lets developers integrate Python with Excel.
- The xlwings PRO provides more advance features such as reports, embedded Python code in Excel, one-click installers for easy deployment, video training, dedicated support and much more.
Note:
- This notebook is based on xlwings versions 0.30.12.
Please refer to Financial Reporting with Eikon, xlwings and Excel article which give detail regarding how to integrate xlwings with Eikon Data API.
Introduction to the Data Library for Python
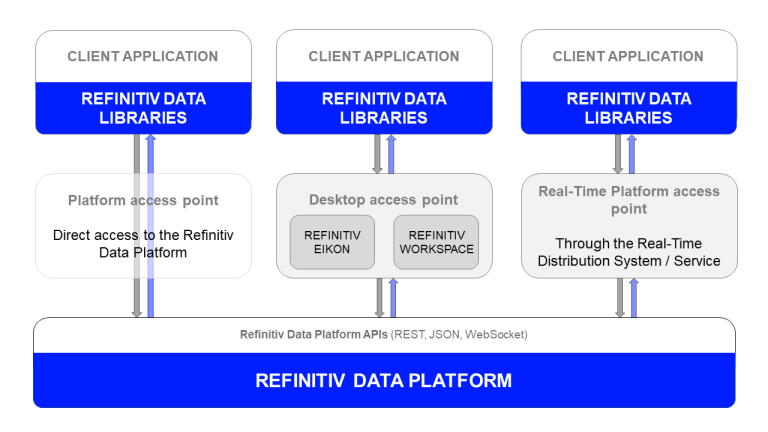
The Refinitiv Data Library for Python provides a set of ease-of-use interfaces offering coders uniform access to the breadth and depth of financial data and services available on the Refinitiv Data Platform. The API is designed to provide consistent access through multiple access channels and target both Professional Developers and Financial Coders. Developers can choose to access content from the desktop, through their deployed streaming services, or directly to the cloud. With the Refinitiv Data Library, the same Python code can be used to retrieve data regardless of which access point you choose to connect to the platform.
Depending on the level of service and data requirements, developers can easily choose how to access data services using the appropriate access channel defined within the library.
The RDP Library are available in the following programming languages:
For more deep detail regarding the RDP Libraries, please refer to the following articles and tutorials:
Disclaimer
As this notebook is based on RD Library Python versions 1.5.0.
Code Walkthrough
Import xlwings and RD Library
Let start with xlwings CE first. The application needs to import xlwings and refinitiv.data packages in order to interact with xlwings CE and RD library.
# import xlwings and RD library
import xlwings as xw
import refinitiv.data as rd
# import all required libraries
import os
import sys
from dotenv import dotenv_values
import numpy as np
import pandas as pd
import matplotlib.pyplot as plt
import matplotlib
import matplotlib.ticker as tick
import json
Initiate and Getting Data from RD Library
The RDP Libraries let application consumes data from the following platforms
- DesktopSession (Eikon/Refinitiv Workspace)
- PlatformSession (RDP, Refinitiv Real-Time Optimized)
- DeployedPlatformSession (deployed Refinitiv Real-Time/ADS)
This article only focuses on the DesktopSession. However, for other session types, the main logic is the same when it interacts with xlwings library.
# Open Desktop Session
rd.open_session(config_name='./refinitiv-data.config.json')
# Result: <refinitiv.data.session.Definition object at 0x1b9bf0caaa0 {name='workspace'}>
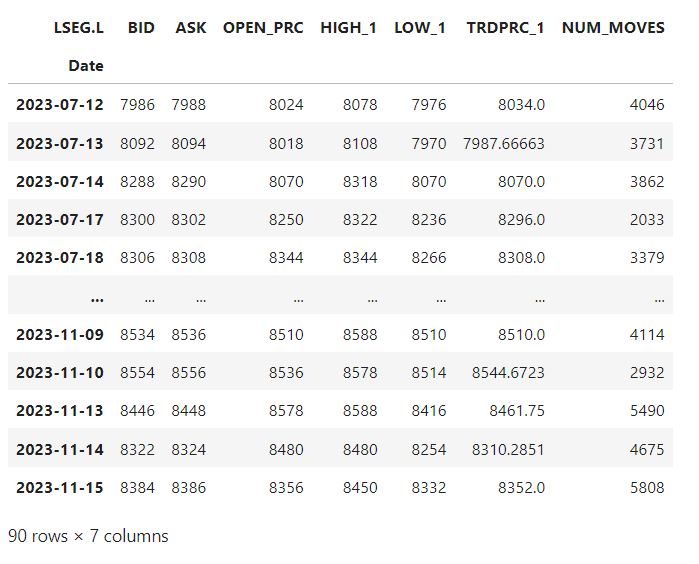
Once the application successfully creates a session with a running Workspace desktop application, we can request Time-Series data as an example with the Function Layer.
# Declare parameter(s)
universe = 'LSEG.L'
historical_title = '%s Historical Data' % (universe)
df_historical = rd.get_history(
universe=[universe],
fields=['BID','ASK','OPEN_PRC','HIGH_1','LOW_1','TRDPRC_1','NUM_MOVES'],
interval='1D',
count = 90
)
df_historical
Example Data:
Interact with xlwings CE
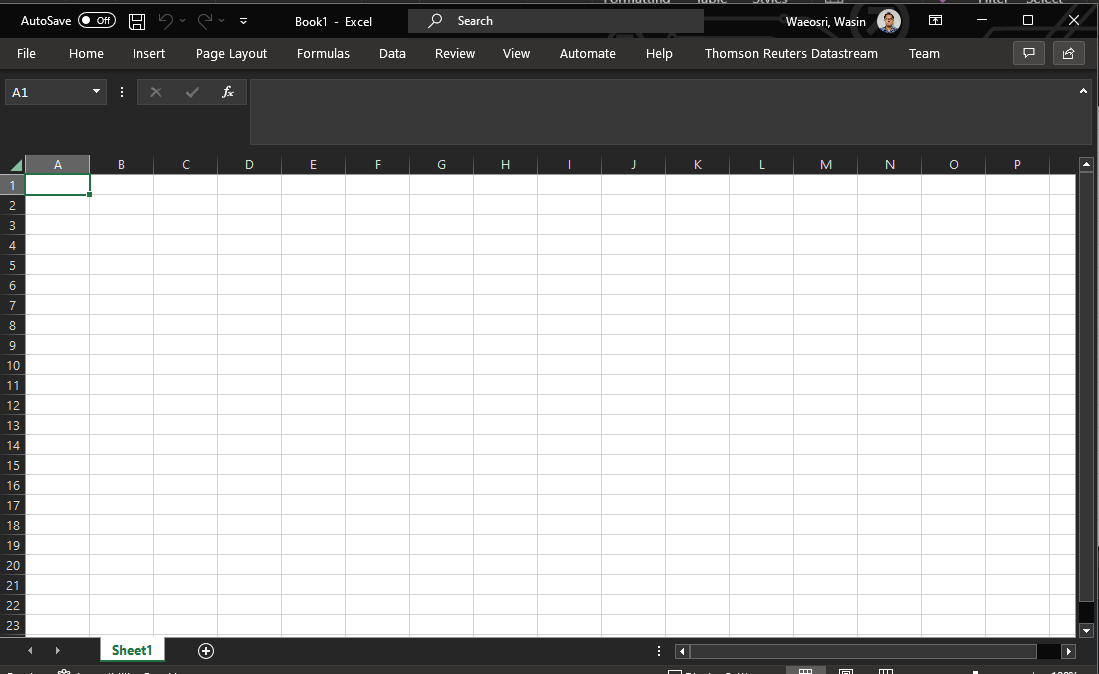
With xlwings, we can export this df_historical DataFrame to Excel directly. The first step is to initiate the xlwings object and establish a connection to a workbook.
wb = xw.Book() # Creating an new excel file. wb = xw.Book(filename) would open an existing file
The above step initiates an xlwings workbook class in wb object. The wb = xw.Book() statement creates a new excel file. If you are using wb = xw.Book(filename), the xlwings will open an existing file.
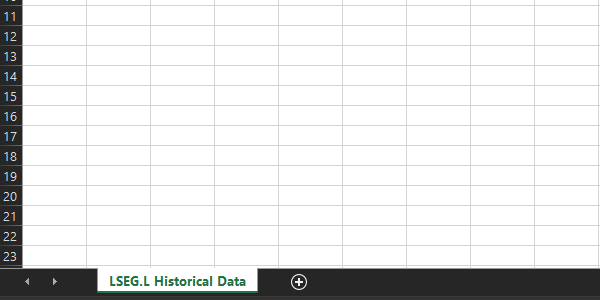
Next, instantiate the xlwings sheet object. The application will interact with the Excel file mostly via this sheet object.
# Select the first excel sheet, and rename it
historical_sheet = wb.sheets[0]
historical_sheet.name = historical_title
Then you can just pass your DataFrame object to sheet.range(<cell>).value property to set Pandas DataFrame to Excel file directly.
# Set historical_sheet dataframe to cell A1
historical_sheet.range("A1").value = df_historical.head(30)
The result is following:
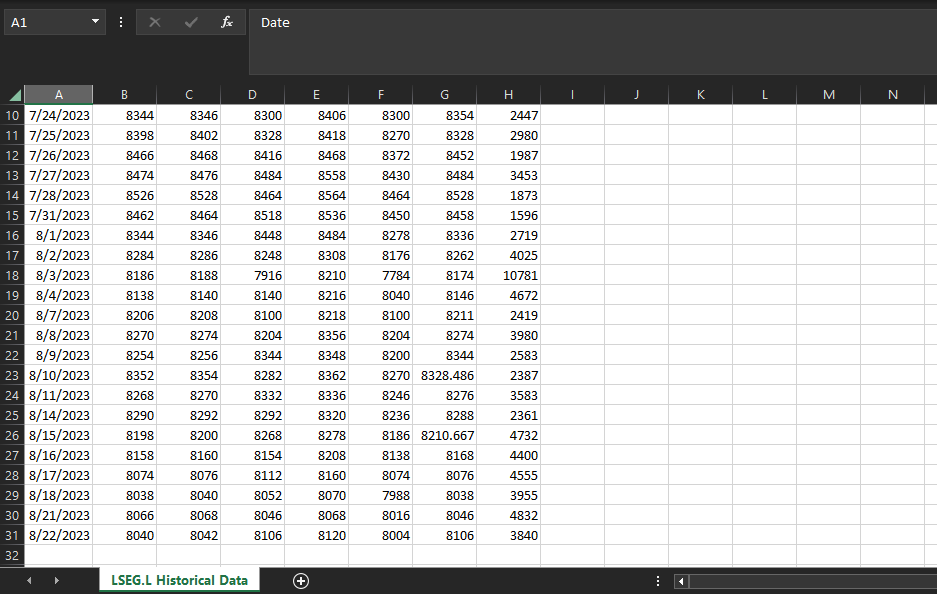
That is, the application is ready to get and export Refinitiv Data to the excel file.
More Interaction and Customization with xlwings CE
The above example shows how to export data "as is" which often hard to read. The application can use xlwings API to customize excel report look and feel, and then customize Pandas DataFrame to make data easier to understand.
# Clear current sheet
historical_sheet.clear()
Then we use the xlwings Sheet object and its API property to change the report look and feel.
Note: The xlwings API property supports Windows only. For MacOS, please refer to this page.
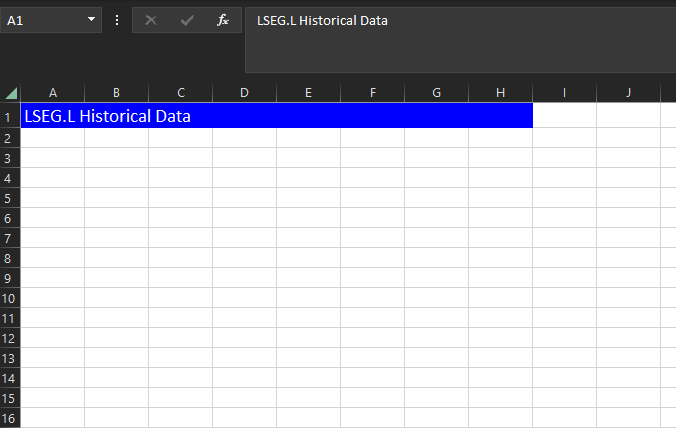
historical_sheet.range("A1").value = historical_title
historical_sheet.range("A1").api.Font.Size = 14 # Change font size
historical_sheet.range("A1").api.Font.ColorIndex = 2 # Change font color
historical_sheet.range('A1:H1').color = (0,0,255) # Change cell background color
The above statements create the following excel report format.
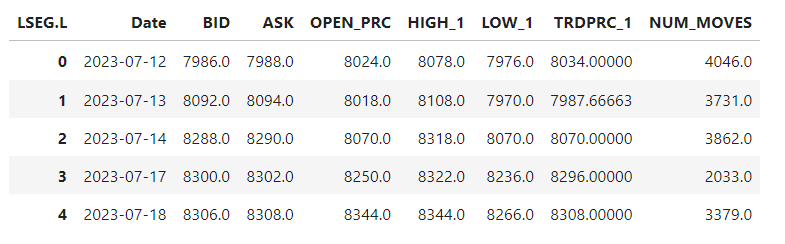
Next, we restructure df_historical DataFrame to make it easier to read by naming the index column to "Date"
df_historical.index.name = 'Date'
df_historical.head(5)
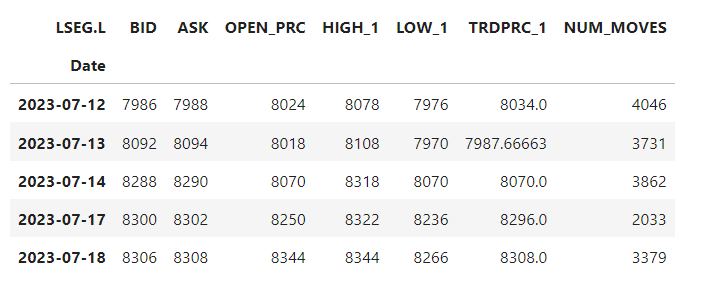
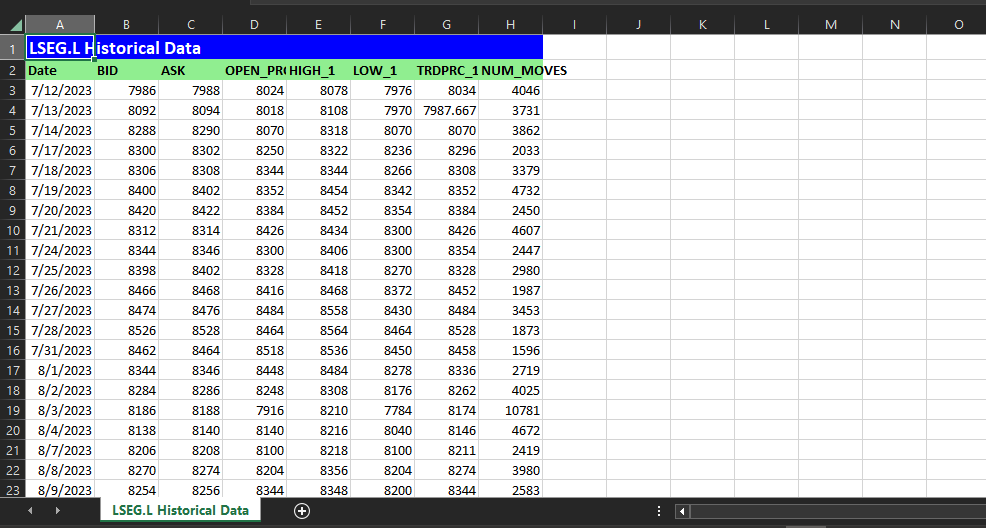
Next, we set the DataFrame object to A2 cell, then set column header font and background color to make them distinguishable from data.
historical_sheet.range("A2").value = df_historical.head(30)
#Make Column headers bold
historical_sheet.range('2:1').api.Font.Bold = True
# Change cell background color
historical_sheet.range('A2:H2').color = (144,238,144)
# Set sheet autofit the width of row
historical_sheet.autofit('r')
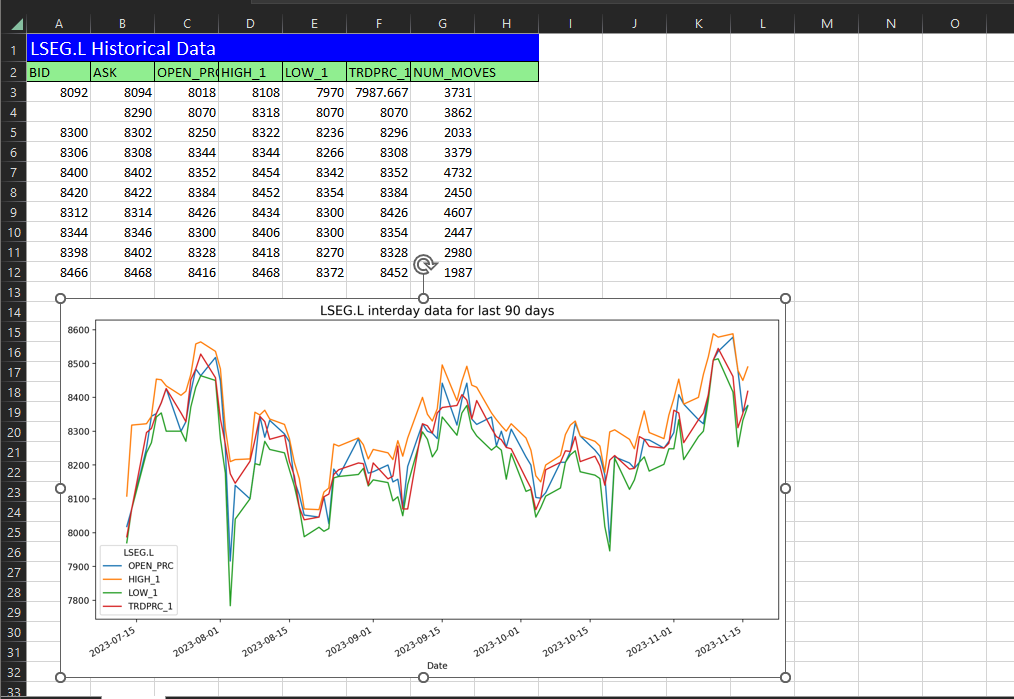
The result is the following readable report table:
Plotting a Graph
The xlwings CE also supports Matplotlib library's figures in Excel as a picture. Before we plot a graph, we need to transform and re-format our data in DataFrame object first.
We begin by changing all non-Date columns data type from String to Float, then change the DataFrame Date index to be a data column. This will let us plot a graph using Date as X-Axis.
for column in df_historical:
df_historical[column]=df_historical[column].astype(float)
df_historical.reset_index(level=0, inplace=True)
df_historical.head(5)
Next, we sort data in ascending order and plot a graph with pyplot library.
# Plotting a Graph
columns = ['OPEN_PRC','HIGH_1','LOW_1','TRDPRC_1']
df_historical.set_index('Date',drop=True,inplace=True)
fig = plt.figure() # Create Figure
# Create graph title from Company and RIC names dynamically.
plt.ticklabel_format(style = 'plain')
plt.title('VOD.L interday data for last 90 days', color='black',fontsize='x-large')
ax = fig.gca()
df_historical.plot(kind='line', ax = fig.gca(), y=columns, figsize=(14,7) )
plt.show()
The plt.show() method above just creates a figure object, and then plots and shows a line graph in Jupyter Notebook. We can use the xlwings pictures API to export this figure object into the Excel sheet as a picture.
We will add a graph at the end of the data table in our Excel sheet, so we need to get the position of the last row of the report table with the xlwings end() function.
- The sheet.cells.last_cell statement returns the lower right cell
- The sheet.cells.last_cell.row statement returns the row of the lower right cell
# historical_sheet.cells.last_cell.row = row of the lower right cell
'''
change to your specified column, then go up until you hit a non-empty cell
'''
historical_last_row = historical_sheet.range((historical_sheet.cells.last_cell.row, 1)).end('up').row
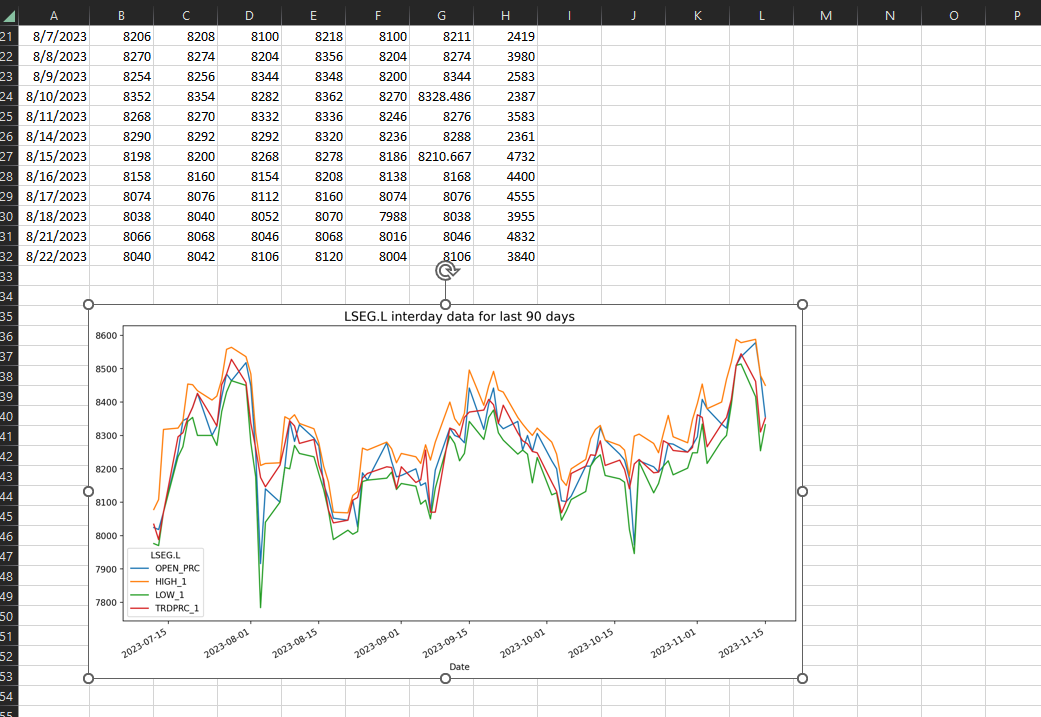
After we have the position of the last row in historical_last_row variable, mark the position of the picture at the last row of the table + 3 rows row down to make some space between data table and graph. Finally, we add the figure object as a picture to the xlwings CE sheet object with pictures API at the marked position.
rng = historical_sheet.range('B{row}'.format(row = historical_last_row + 3))
historical_sheet.pictures.add(fig, name='MyPlot', update=True, top=rng.top, left=rng.left)
The result is following:
Adding New Sheet
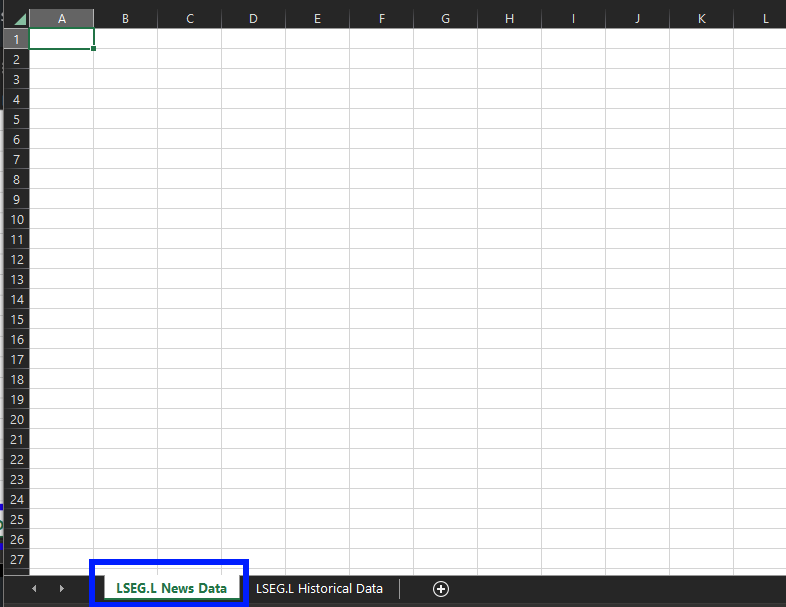
An Excel file can contain many reports created from different data to help make business decisions, xlwings lets you create a new sheet and export data into it dynamically via Python application by using Sheet object add() function.
news_sheet_title = '%s News Data' % (universe)
# Create new sheet for News Data
wb.sheets.add(news_sheet_title)
The above xlwings statement creates a new sheet in your Excel workbook.
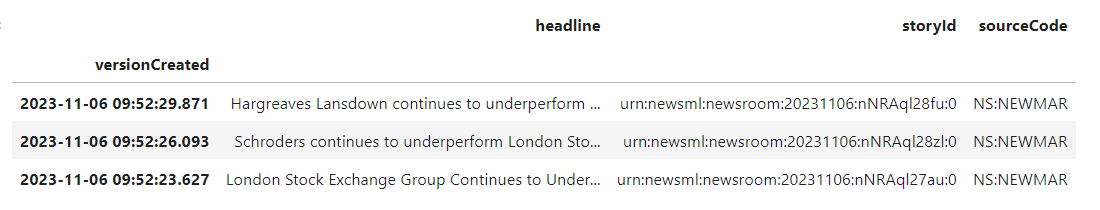
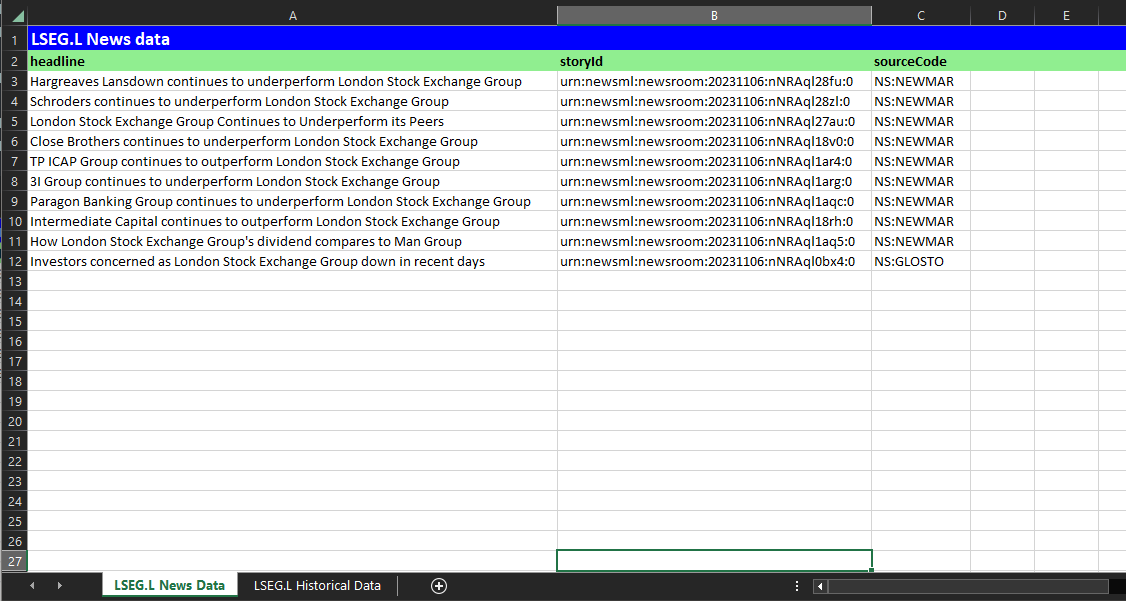
Then we will request News data from the RD Library and export it to this newly created sheet object.
# -- Requesting News Data
from datetime import timedelta
news_df = rd.news.get_headlines(universe, start="20.03.2021", end=timedelta(days=-10), count=10)
news_df.head(3)
The example result of response data is following:
Then we can initiate the xlwings sheet object for ESG data as a separate esg_sheet variable, customize that sheet, and put data in it.
# initiate the xlwings sheet object]
news_sheet = wb.sheets[news_sheet_title]
#Set Sheet Title
news_sheet.range("A1").value = f'{universe} News data'
news_sheet.range("A1").api.Font.Size = 14 # Change font size
news_sheet.range("A1").api.Font.ColorIndex = 2 # Change font color
news_sheet.range('A1:U1').color = (0,0,255) # Change cell background color
Saving Excel Report
You can dynamically save this excel file with xlwings Book object save() function.
wb.save('rdp_report.xlsx')
Reporting with xlwings PRO
The code walkthrough above shows that you can create an excel report file from Refinitiv Data easily with xlwings CE API. However, the Python application source code is a combination of formatting the report's look & feel and handling the data which makes the source code difficult to maintain in the long run.
The xlwings PRO has features to solve all of CE version limitations. The xlwings Reports provides a capability to generate excel report file with the following features:
- Separation of code and design: Users without coding skills can change the template on their own without having to touch the Python code.
- Template variables: Python variables (between curly braces) can be directly used in cells, e.g. {{ title }}. They act as placeholders that will be replaced by the actual values.
- Frames for dynamic tables: Frames are vertical containers that dynamically align and style tables that have a variable number of rows.
You can get a free trial for xlwings PRO here, then follow the instruction on How to activate xlwings PRO page.
Once you have activated your xlwings PRO license, please install the xlwings PRO additional dependencies using the following command::
$> pip install "xlwings[all]"
Then create Excel template file as *rdp_report_template.xlsx* file with the following template format:
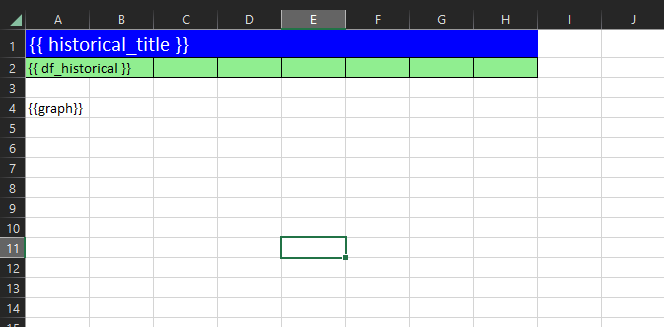
This template defines all look and feel (font, color, etc.) and also positions of auto-generated data with variables inside {{ and }} syntax.
Then use the report-api to generate excel files based on the template file and data with the create_report() function.
from xlwings.pro.reports import create_report
app = xw.App(visible=True)
report = app.render_template(
'rdp_report_template.xlsx',
'rdp_report_pro.xlsx',
historical_title=historical_title,
df_historical=df_historical.head(10),
graph = fig)
The render_template() above function will generate the rdp_report_pro.xlsx file with the format defined in rdp_report_template.xlsx and the data that we pass to the function. The application does not need to hard code the setting for cell, sheet and workbook anymore. The xlwings PRO report package automatically replaces {{ historical_title }}, {{ df_historical }} and {{graph}} variables with data that the application passes through report package's create_report() function.
The application can pass text, DataFrames, or even Graphs to the function and xlwings will generate the excel report file based on the look and feel of the template file.
Prerequisite
The demo project requires the following dependencies:
- Workspace access credential.
- xlwings library version 0.30.x and above.
- Microsoft Excel.
- Python Anaconda or MiniConda distribution/package manager.
- Jupyter Lab.
- Internet connection.
Please contact your Refinitiv's representative to help you to access Refinitiv Workspace credentials. You can generate/manage the AppKey by follow the steps on "Desktop - Eikon or Refinitiv Workspace" section of RD Library - Python Quickstart page.
Running the Notebook example.
The first step is to unzip or download the example application from GitHub into a directory of your choosing and follows the steps on Running the xlwings CE Notebook example section of the repo.
Conclusion and Next Step
The xlwings CE library lets Python developers integrate data with Excel in a simple way. The library is suitable for a wide range of developers from casual coders, data scientists, professional traders to seasoned programmers, and allows them to work on data analysis and generate reports based on their skill.
The next part will cover and show how powerful xlwings PRO is when comparing to CE library. Python developers' life will be easier with xlwings PRO.
At the same time, the Data Library for Python let developers rapidly access the Data Platform content with a few lines of code that easy to understand and maintain. Developers can focus on implement the business logic or analysis data without worry about the connection, authentication detail with the Platforms.
The integration between LSEG APIs and xlwings is not limited to only the Data Library. Any LSEG APIs that support Python programming language such as Data API (Data API-xlwings article), or RKD API, or DataStream Web Service - Python can work with xlwings library using the same concept and code logic as this Data Library notebook examples.
References
You can find more details regarding the Data Library for Python, xlwings and, related technologies for this notebook from the following resources:
- Data Library for Python on the LSEG Developer Community web site.
- Xlwings web site.
- Xlwings CE Document page.
- xlwings Pro page.
- xlwings API Reference page.
- xlwings Reports page.
- xlwings Embedded Code page.
- Financial Reporting with Eikon, xlwings and Excel.
For any questions related to this article or Data Library, please use the Developers Community Q&A Forum.