
Using RDP API to request ESG data on Jupyter Notebook
INTRODUCTION
Environmental, Social and Governance (ESG) is a set of standards for a company's operations that investors use to evaluate corporate behavior, determine the future financial performance and decide whether it will be beneficial to invest in a company or not. The ESG information from Refinitv enables our clients to benchmark, compare and integrate extra-financial information into their investment processes to identify companies with quality management and reduced risk exposure. Please refer to the ESG Learning Section on the Developer Community for more details about the ESG data and its coverage provided by Refinitiv.
This example will demonstrate how we can retrieve ESG data from the Refinitiv Data Platform (RDP). We will be using Python with RDP API to request ESG data on the Jupyter Notebook. The notebook allows the user to create and share documents that contain live code, narrative text, visualizations and we can also plot the graph on the notebook.
The Jupyter Notebook with Python codes will be provided on GitHub.
Pre-requisites:
- Python 3.6 or later version.
- Required Python Packages: getpass, json, requests, pandas, numpy, mathplotlib.
- Jupyter Notebook. You can install Jupyter Notebook on your local machine and then test the example on the machine. The alternate choice is a free Jupiter Notebook on cloud environment such as Azure Notebook provided by Microsoft. You can find more details from this tutorial. If you are not familiar with Jupyter Notebook, the following tutorial created by DataCamp may help.
- RDP account with permission to access ESG basic or higher level.
Implementation
There are two main steps for the implementation according to the tutorial.
- Get Access Token from RDP Authentication Endpoint.
- Get specific ESG data like the basic score from the REST endpoint.
- Display data and plot a graph.
Get Access Token
Get RDP Username and Password
The application will use getpass to get the username and password from the user.
import getpass as gp
username=input('Enter RDP username:')
clientid=input('Enter client id/app id:')
password=gp.getpass('Enter RDP Password:')
Get access token from authentication endpoint
The application sends HTTP post with required parameters according to the RDP tutorial to get the Access Token from RDP server.
from json import dumps, loads, load
from requests import post,get
#Get access token from RDP server
getTokenEndpoint="https://api.refinitiv.com/auth/oauth2/v1/token"
refreshToken=None
accessToken=None
_header= {}
_header['Accept']='application/json'
_params={}
if refreshToken is None:
_params={
"username": username,
"password": password,
"client_id": clientid,
"grant_type": "password",
"scope": "trapi",
"takeExclusiveSignOnControl": "true"
}
else:
_params={
"refresh_token": refreshToken,
"username": username,
"grant_type": "refresh_token"
}
resp=post(url=getTokenEndpoint,data=_params,headers=_header,auth=(username,""))
If the returned status code from HTTP response is not 200 (OK), we assume that there is an error occurred, therefore, the application will print the status code and the response status message then exit the application. Otherwise, get the Refresh Token and Access Token from the HTTP response message and print it out.
if resp.status_code!=200:
print("Status Code:",resp.status_code," Text:",dumps(loads(resp.text),indent=4))
exit()
else:
#print(dumps(loads(resp.text),indent=4))
from collections import OrderedDict
auth_object=loads(resp.text,object_pairs_hook=OrderedDict)
accessToken=auth_object["access_token"]
refreshToken=auth_object["refresh_token"]
print("Refresh Token:",refreshToken)
print("Access Token:",accessToken)
Retrieve ESG score
In this example, we want to retrieve the ESG Score standard. The score standard operation returns all available scores for a company with three years of historical data. Application has to use the following Endpoint to retrieve the data.
https://api.refinitiv.com/data/environmental-social-governance/v2/views/scores-standard
There is an alternate option for a professional account to get ESG data with full score and then it returns scores with full history. The user can use the following Endpoint instead.
https://api.refinitiv.com/data/environmental-social-governance/v2/views/scores-full
The application has to send the server certain GET parameters through the requested endpoint/URL. In this case, it has to pass a universe as HTTP get parameters. The universe could be RIC name or ISIN or any other supported value.
The application needs to set a Bearer access token in the Authorization header of the HTTP request message. See below snippet of codes for the API usage to request full ESG score for the RIC MSFT.O.
ricList="MSFT.O"
esgScoreFullEndpoint="https://api.refinitiv.com/data/environmental-social-governance/v2/views/scores-full?universe="
resp=get(url=esgScoreFullEndpoint+ricList,headers={"Authorization": "Bearer " + accessToken})
if resp.status_code!=200:
print("Status Code:",resp.status_code," Text:",dumps(loads(resp.text),indent=4))
exit()
esg_object=loads(resp.text)
To process the ESG data, we need to convert the data from the JSON object to a pandas data frame. The application needs to get the data and column name from the JSON object and then reconstruct a new dataframe. The application needs to convert the title from a header to numpy array and convert data array to numpy array as well.
import pandas as pd
import numpy as np
headers=esg_object['headers']
#Get column headers/titles using lambda
titles=map(lambda header:header['title'], headers)
dataArray=np.array(esg_object['data'])
df=pd.DataFrame(data=dataArray,columns=titles)
if df.empty is False:
print(df)
It should return the data like the following sample output.
Instrument Period End Date ESG Combined Score ESG Score ... Shareholders Score CSR Strategy Score ESG Reporting Scope ESG Period Last Update Date
0 MSFT.O 2017-06-30 46.6701 92.5389 ... 85.9866 99.1549 100 2019-04-19T00:00:00
1 MSFT.O 2016-06-30 48.0423 94.0551 ... 86.9814 99.2379 100 2019-04-19T00:00:00
2 MSFT.O 2015-06-30 47.4991 91.2772 ... 88.359 98.8152 100 2019-04-19T00:00:00
3 MSFT.O 2014-06-30 46.9028 92.4262 ... 96.1577 98.6028 100 2019-04-26T00:00:00
4 MSFT.O 2013-06-30 46.7653 92.3679 ... 92.9656 90.1316 100 2019-04-26T00:00:00
5 MSFT.O 2012-06-30 44.6859 86.8295 ... 95.5339 90.2464 100 2019-04-26T00:00:00
6 MSFT.O 2011-06-30 45.8487 90.393 ... 97.1853 83.6233 100 2019-03-01T00:00:00
7 MSFT.O 2010-06-30 46.4804 91.6676 ... 95.5005 87.3104 100 2019-03-01T00:00:00
8 MSFT.O 2009-06-30 46.2809 91.1054 ... 97.869 95.79 None 2018-12-19T00:00:00
9 MSFT.O 2008-06-30 44.3057 85.6702 ... 61.534 91.3934 None 2018-12-17T00:00:00
10 MSFT.O 2007-06-30 45.7609 88.8901 ... 73.0712 92.8783 None 2018-12-17T00:00:00
11 MSFT.O 2006-06-30 38.0189 73.4404 ... 90.3933 94.9319 None 2018-12-17T00:00:00
12 MSFT.O 2005-06-30 69.1562 69.1562 ... 86.2879 96.3636 None 2018-12-17T00:00:00
13 MSFT.O 2004-06-30 33.8568 66.8939 ... 51.8613 87.8173 None 2018-12-17T00:00:00
14 MSFT.O 2003-06-30 27.3133 50.3409 ... 28.7209 40.5814 None 2018-12-17T00:00:00
15 MSFT.O 2002-06-30 31.9662 62.4618 ... 55.8275 41.958 None 2018-12-17T00:00:00
Plot Graph from ESG Score
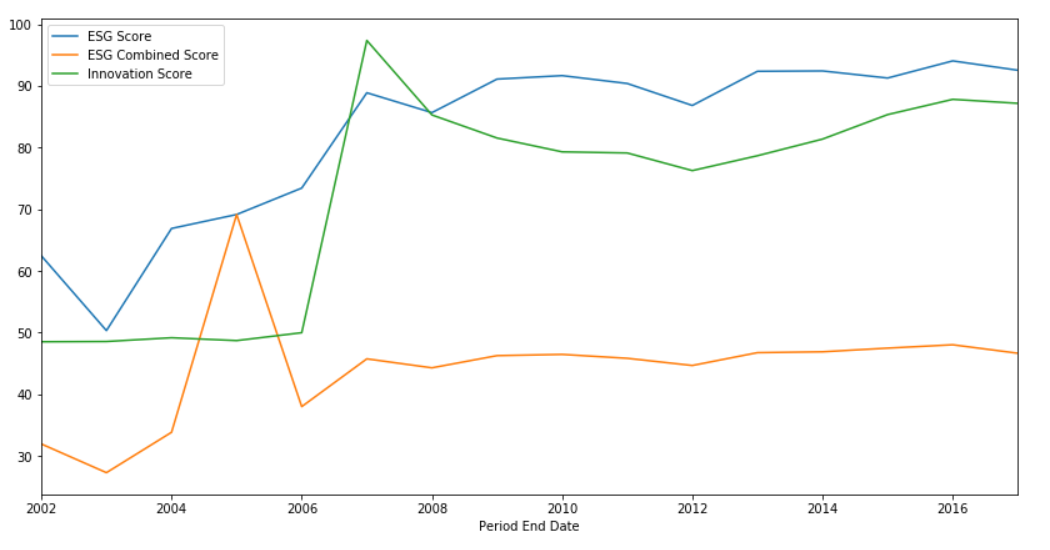
To compare specific ESG data between the years, Jupyter Notebook user may use the mathplotlib to plot the graph.
For this example, we want to compare columns "ESG Score", "ESG Combined Score" and "Innovation Score" between the years. I have to create a new data frame from the original data frame df using the following codes.
The data for the X-axis is a Period End Date and the Y-axis is the ESG scores. And we want to display only the year (eg "2017", "2016") therefore we need to reformat the data in "Period End Date" column using below codes. The example also sorting the year ascending.
Note that you can change the column in dataPlot to plot the graph for specific data you want. If you have permission to request only a basic score you might need to change the column accordingly.
dataPlot['Period End Date']= dataPlot['Period End Date'].str.split('-').str[0]
dataPlot.sort_values('Period End Date',ascending=True,inplace=True)
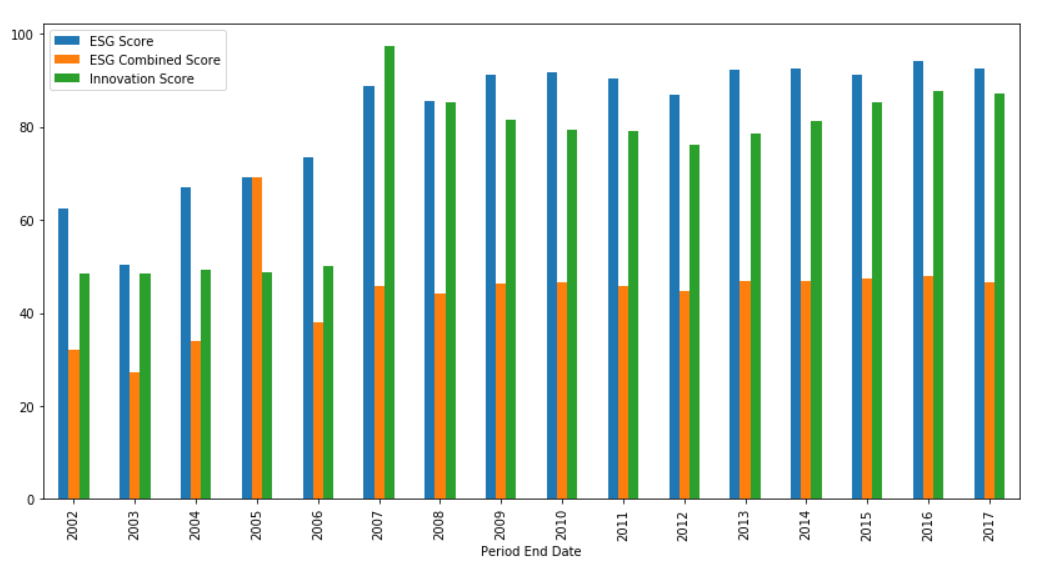
Then using a plot method from data frame mathplotlib to plot a line graph which is default kind and then plot it again using a bar graph using the following codes.
dataPlot.plot(x='Period End Date',y=['ESG Score','ESG Combined Score','Innovation Score'],figsize=(14,7))
dataPlot.plot(x='Period End Date',y=['ESG Score','ESG Combined Score','Innovation Score'],kind='bar',figsize=(14,7))
It will be displaying the following sample graphs on the Jupyter Notebook.
Compare ESG Score for multiple universes
For the new scenario, I'm interested in comparing the value of a number of Woman Manager and CO2 Emission Total used by a top tech company such as Microsoft, IBM, Facebook, Google/Alphabet, and Amazon.
Based on the details from RDP Swagger page, we can get the data using basic score endpoint and we just need to pass a list of RIC for each company as a universe parameters. Below are a snippet of codes to demonstrate the API usage.
ricList="IBM,AMZN.O,MSFT.O,GOOGL.O,FB.O,APPL.O"
esgฺBasicEndpoint="https://api.refinitiv.com/data/environmental-social-governance/v2/views/basic?universe="
resp=get(url=esgฺBasicEndpoint+ricList,headers={"Authorization": "Bearer " + accessToken})
if resp.status_code!=200:
print("Status Code:",resp.status_code," Text:",dumps(loads(resp.text),indent=4))
exit()
esg_BasicObject=loads(resp.text)
headers=esg_BasicObject['headers']
#Get column headers/titles using lambda
titles=map(lambda header:header['title'], headers)
basicDataArray=np.array(esg_BasicObject['data'])
basicDf=pd.DataFrame(data=basicDataArray,columns=titles)
if basicDf.empty is False:
print(basicDf)
It will show the following result.
Instrument Period End Date ESG Reporting Scope ESG Report Auditor Name ESG Period Last Update Date CO2 Equivalents Emission Total Women Managers Average Training Hours
0 IBM 2017-12-31 100 None 2019-03-30T00:00:00 1496517 None 59.578
1 AMZN.O 2017-12-31 100 None 2019-04-19T00:00:00 None 26 None
2 GOOGL.O 2017-12-31 100 None 2019-05-04T00:00:00 3367941 25.5 None
3 FB.O 2017-12-31 100 Bureau Veritas North America, Inc. 2019-05-04T00:00:00 638000 28 None
4 MSFT.O 2017-06-30 100 None 2019-04-19T00:00:00 2790348 19.1 None
Display Company Name
We have an additional requirement to display Company Name rather than using RIC codes. Basically, the data returned by the ESG basic score has only an Instrument name but it does not have a company named. Therefore, I need to create a function for getting the company name from ESG universe data. I found that the ESG universe endpoint can provide the company names that I want. I will use it later when I plot the graph. Anyway, we found that we can't find some RIC code using the universe Endpoint so it will return the original RIC name instead.
esgUniverseEndpoint="https://api.refinitiv.com/data/environmental-social-governance/v2/universe"
resp=get(url=esgUniverseEndpoint,headers={"Authorization": "Bearer " + accessToken})
if resp.status_code!=200:
print("Status Code:",resp.status_code," Text:",dumps(loads(resp.text),indent=4))
exit()
esg_universe = loads(resp.text)
def GetRicName(ricName):
if 'data' in esg_universe:
searchItem = list(filter(lambda data: data[1]==ricName, list(esg_universe['data'])))
if len(searchItem)>0:
return searchItem[0][2]
return None
if GetRicName('MSFT.O') is not None:
print("MSFT.O is \""+ GetRicName("MSFT.O")+"\"")
else:
print("Unable to find name for MSFT.O")
Output.
MSFT.O is "Microsoft Corp"
Next step we will be using the data from a basicDf dataframe to plot horizontal bar chart for comparing a Woman Managers and CO2 Emission Total from each company. Base on a result from a dataframe, we found that column number 5 is a data for "CO2 Equivalents Emission Total" and column number 6 is a data for "Women Managers", then we will use the index to extract the data. Below are the codes we use to extract both data from the data frame.
# Extract CO2, Woman Manager and Instrument from the dataframe and convert to numpy array
co2= [val for sublist in np.array(basicDf.iloc[:,5:6]) for val in sublist]
woman=[val for sublist in np.array(basicDf.iloc[:,6:7]) for val in sublist]
instrument=[val for sublist in np.array(basicDf.iloc[:,0:1]) for val in sublist]
print(co2)
print(woman)
print(instrument)
Result
[1496517, None, 3367941, 638000, 2790348]
[None, 26, 25.5, 28, 19.1]
['IBM', 'AMZN.O', 'GOOGL.O', 'FB.O', 'MSFT.O']
Next step we need to get a company name for each instrument from the instrument list.
instrumentorg=np.array([])
for val in instrument:
if GetRicName(val) is None:
instrumentorg=np.append(instrumentorg,val)
else:
instrumentorg=np.append(instrumentorg,GetRicName(val))
The last step we construct dataframe for plotting the graph for displaying data for CO2 Emission Total with Woman Managers separately because of the difference between the scale of each data. We will be using the company name as an index.
df1 = pd.DataFrame({"Woman Managers":woman}, index=instrumentorg)
df1.plot.barh(y='Woman Managers',figsize=(14,7))
df2 = pd.DataFrame({"CO2 Emission Total":co2}, index=instrumentorg)
plt=df2.plot.barh(y='CO2 Emission Total',color=(0.5, 0.25, 0.15, 1),figsize=(14,7))
plt.set_xlabel('(tonnes)')
It will show the following horizontal bar chart on Jupyter Notebook.
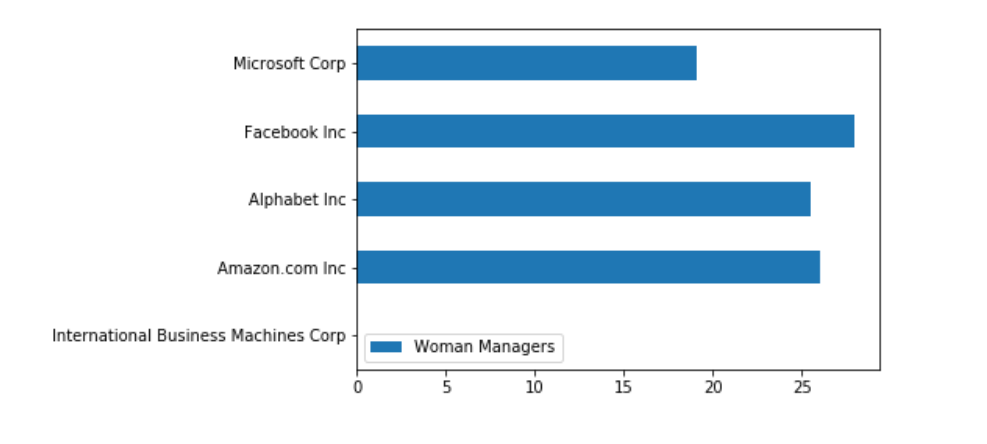
Base on the data, we do not have the report for IBM so it does not have the graph for IBM.
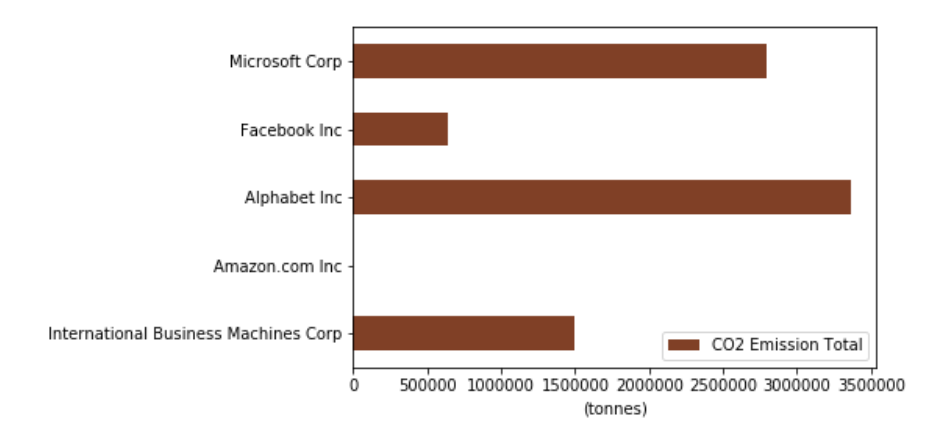
Based on the data, we do not have a CO2 report Amazon.
You can change or modify Python codes in the notebook to displaying data from other columns of the dataframe from the basic or full ESG Score.
REFERENCES
DOWNLOADS
APIS RELATED TO THIS ARTICLE