
Overview
With the rise of Data Scientists, Financial coders, or Traders (aka Citizen Developers), the Pandas library has become the defacto tool for data analysis with Python programming language. Pandas is powerful, flexible, has excellent community support, and it keeps improving. However, developers require a great skill of Python and the library to using Pandas efficiently. This learning curve makes some developers and data scientists stuck with the "coding" time instead of "analysis" time.
PandasGUI is the Graphical User Interface tool that can solve this learning curve issue. The tool wraps Pandas functions into an easy to use data analytic tool for developers and data scientists to start with. This article shows how to use PandasGUI tool for basic data analysis with the simple GUI interface. The demo application uses Corona Virus Disease (COVID-19) data from Eikon Data API as an example of a dataset.
Note: The PandasGUI tool is still under development. The tool is not compatible with Eikon Data API and Refinitiv Data Platform (RDP) Libraries - Python on IPython/Notebook environment yet. This example project is focusing on the console environment only.
Introduction to PandasGUI
PandasGUI is a GUI tool for analyzing Pandas DataFrames. The tool is developed by @adamerose. The tool comes with the built-in Pandas function that lets data scientists explore the DataFrame object, DataFrame manipulation, filter data, reframing DataFrame object, and also plotting a simple graph for visualization.
Please see a full video that demonstrates the PandasGUI tool in this PandasGUI Demo Youtube link.
Note:
- This project is based on PandasGUI version 0.2.7.
Introduction to Eikon Data API
The Eikon Data API (aka DAPI) provides access to certain Refinitiv Eikon/Refinitiv Workspace data with seamless workflow with the same data across all applications running on the desktop. The API allows developers to tap into the full breadth of community tools through a modern API with native Python support.

If you are not familiar with Eikon Data API or Python, the following resources are highly recommended to read before you proceed with further steps.
Note:
- This project is based on Eikon Data API versions 1.1.8.
- Pleases see Eikon Data API Usage and Limits Guideline regarding the API data coverage and data limit.
Prerequisite
This example requires the following dependencies software and libraries.
- Refinitiv Eikon or Refinitiv Workspace application with access to Eikon Data APIs.
- Python Anaconda or MiniConda distribution/package manager.
- Internet connection.
Note:
- This Project has been qualified with Python version 3.7.9
Please contact your Refinitiv's representative to help you to access Refinitiv Workspace/Eikon credentials. You can generate/manage the AppKey by follow the steps in Eikon Data API Quick Start page.
$>pip install pandasgui
PandasGUI with a simple USA COVID-19 data
Firstly, let's start by testing the simple USA COVID-19 data. The COVID-19 data is available in Refinitiv Workspace/Refinitiv Eikon via the following instrument's pattern:
- [Country Code]CCOV=ECI: Covid-19 Total Cases
- [Country Code]NCOV=ECI: Covid-19 New Cases
- [Country Code]ACOV=ECI: Covid-19 Active Cases
- [Country Code]RCOV=ECI: Covid-19 Recovered Cases
- [Country Code]DCOV=ECI: Covid-19 Death Cases
So, the list of USA COVID-19 instruments are USCCOV=ECI, USNCOV=ECI, USACOV=ECI, USRCOV=ECI, and USDCOV=ECI instruments.
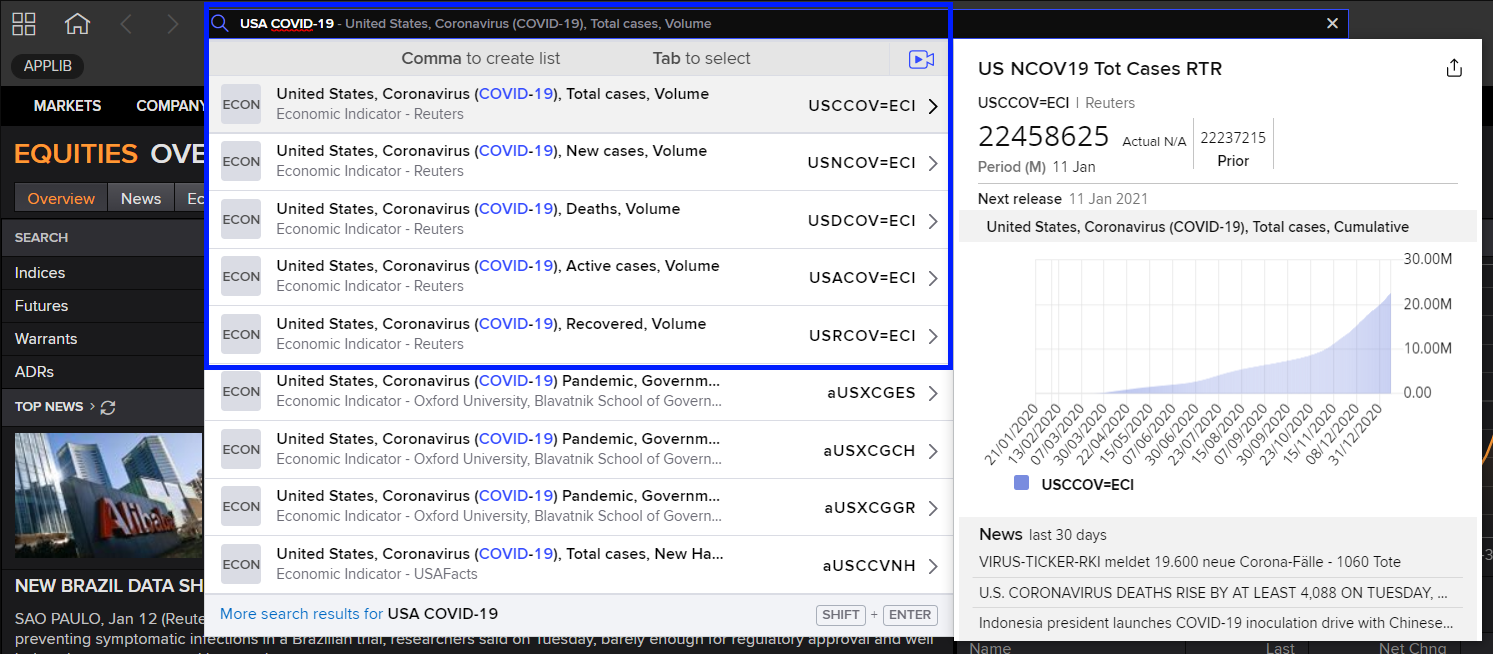
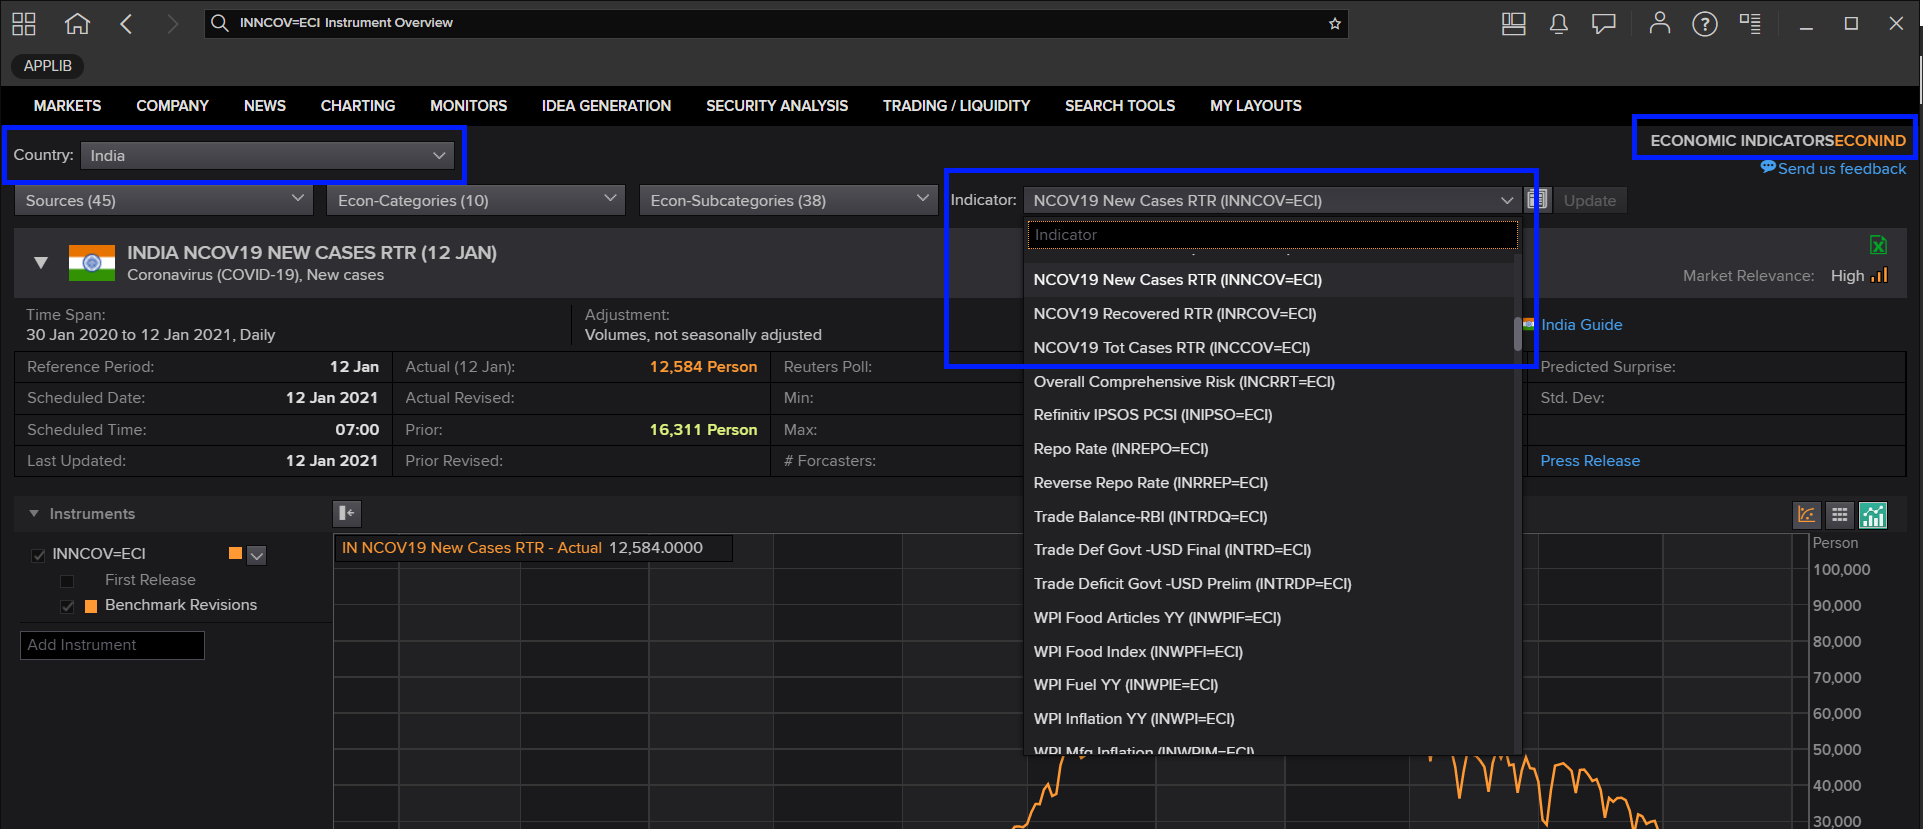
ou can find each country's COVID-19 data from Workspace/Eikon Economic Indicators ("ECONNID") application, and then choosing Country and Indicator values.
The COVID-19 data provides detail with the following fields for users:
- DSPLY_NMLL: Display Name
- COUNTRY: Country code
- CF_DATE: Announcement Date
- ECON_ACT: Actual value
- ECON_PRIOR: Previous value
Getting a simple USA COVID-19 data
We start the code by importing Eikon Data API, Pandas, and defining the required variables.
# Define the list of RICs and fields
import eikon as ek
import pandas as pd
ek.set_app_key('<YOUR_APP_ID_HERE>')
rics_usa_today = ['USCCOV=ECI','USNCOV=ECI','USACOV=ECI','USRCOV=ECI','USDCOV=ECI']
fields = ['DSPLY_NMLL', 'COUNTRY', 'CF_DATE', 'ECON_ACT', 'ECON_PRIOR' #Previous value]
Then we call Eikon Data API get_data() function to get today USA COVID-19 data.
# Get usa Today Covid-19 static
df_usa_today, err = ek.get_data(rics_usa_today, fields)
if err is None:
print(df_usa_today)
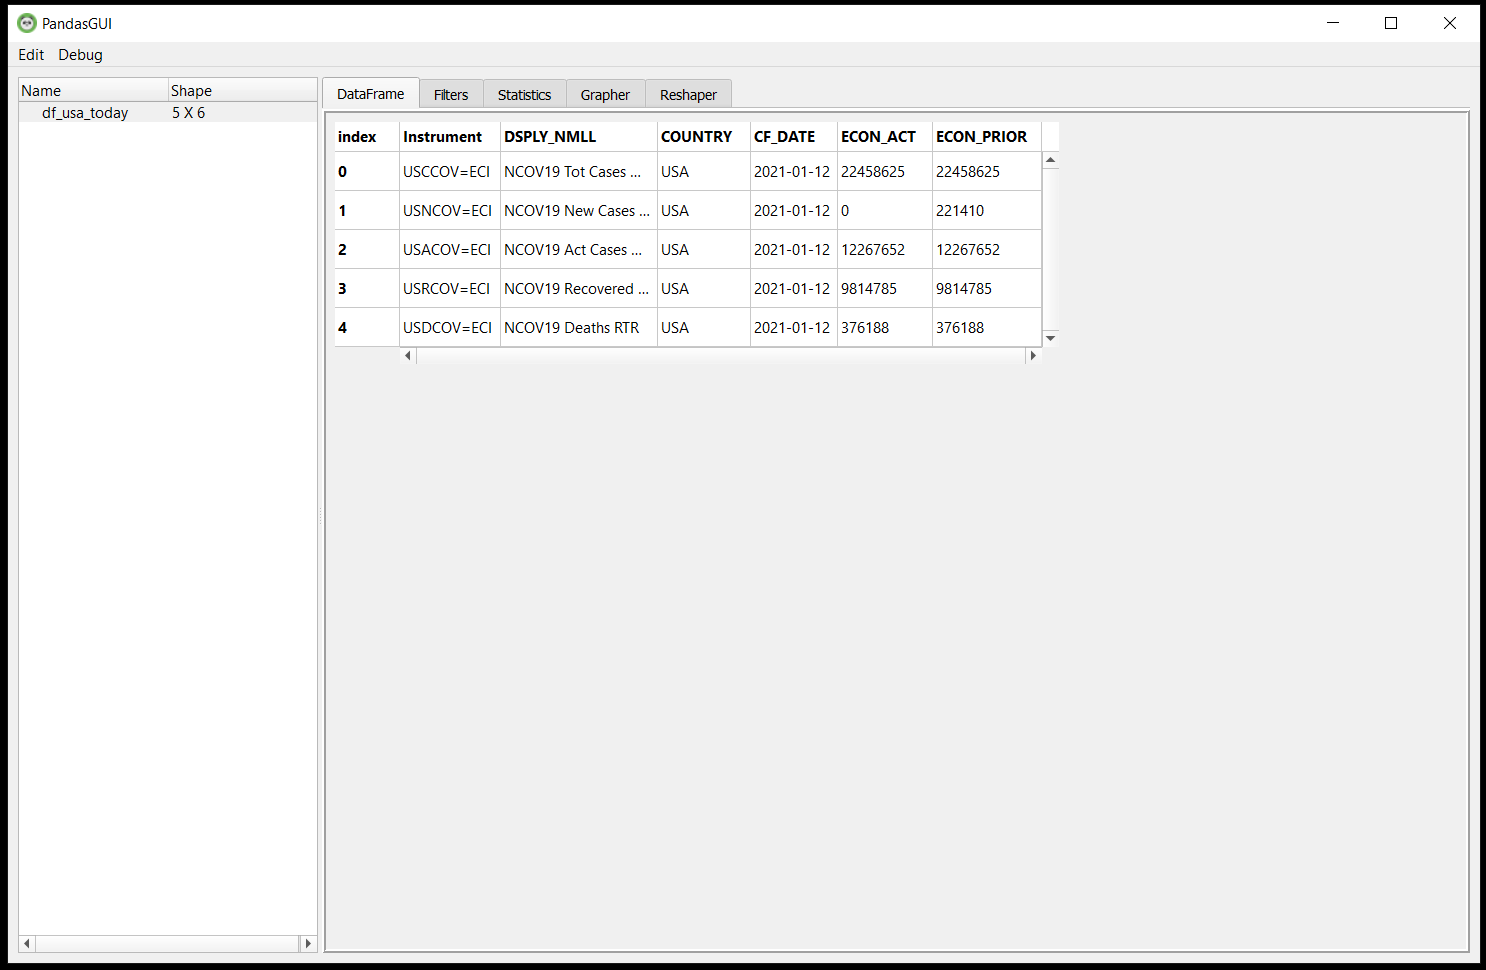
The console application will print the result DataFrame object to the console directly. The result is the following:
#----------- Requesting Today Data -------------#
Instrument DSPLY_NMLL COUNTRY CF_DATE ECON_ACT ECON_PRIOR
0 USCCOV=ECI NCOV19 Tot Cases RTR USA 2021-01-12 22458625 22458625
1 USNCOV=ECI NCOV19 New Cases RTR USA 2021-01-12 0 221410
2 USACOV=ECI NCOV19 Act Cases RTR USA 2021-01-12 12267652 12267652
3 USRCOV=ECI NCOV19 Recovered RTR USA 2021-01-12 9814785 9814785
4 USDCOV=ECI NCOV19 Deaths RTR USA 2021-01-12 376188 376188
Passing a simple USA COVID-19 data to PandasGUI
Then we import PandasGUI library and pass df_usa_today DataFrame object to PandasGUI show() function directly.
from pandasgui import show
# show data in PandasGUI
show(df_usa_today)
The PandasGUI application will show as a separate application.
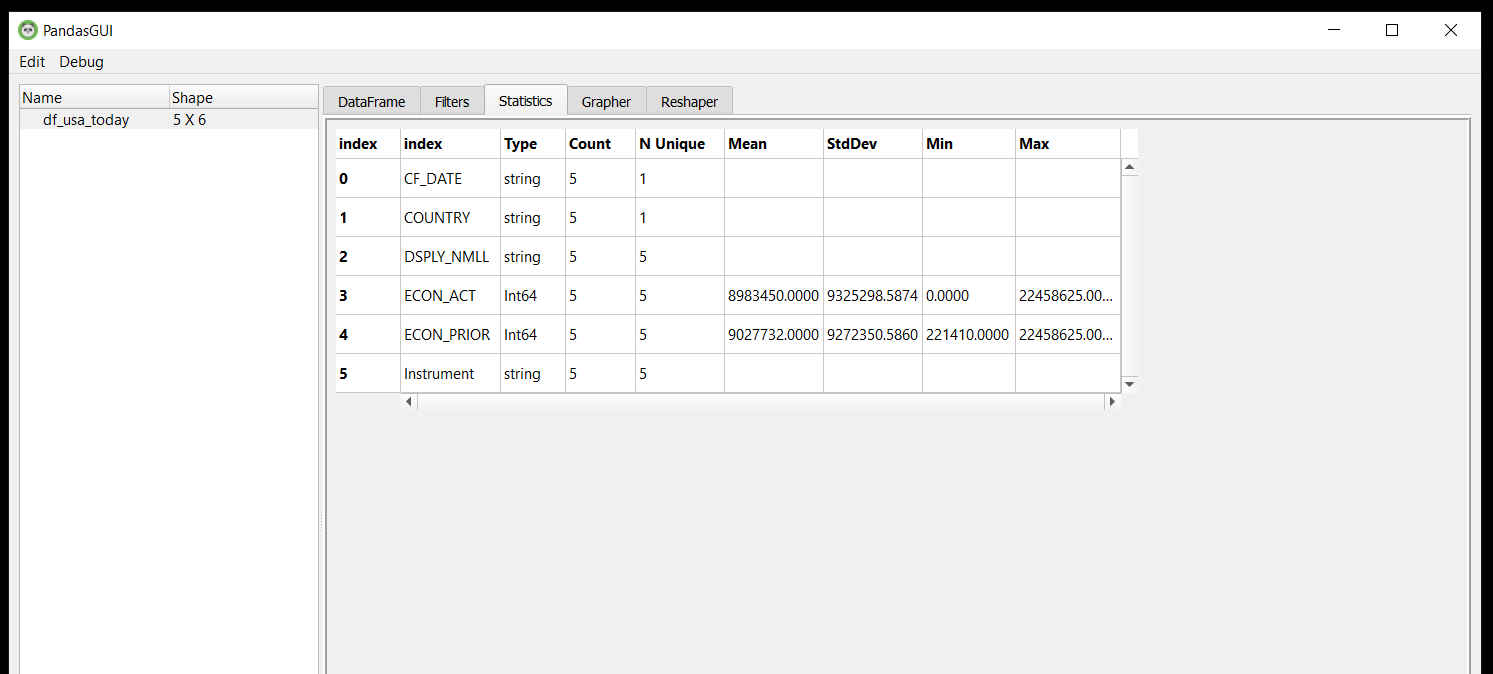
The tool supports view DataFrames and Series, interactive plotting, filtering, statistics summary, and much more.
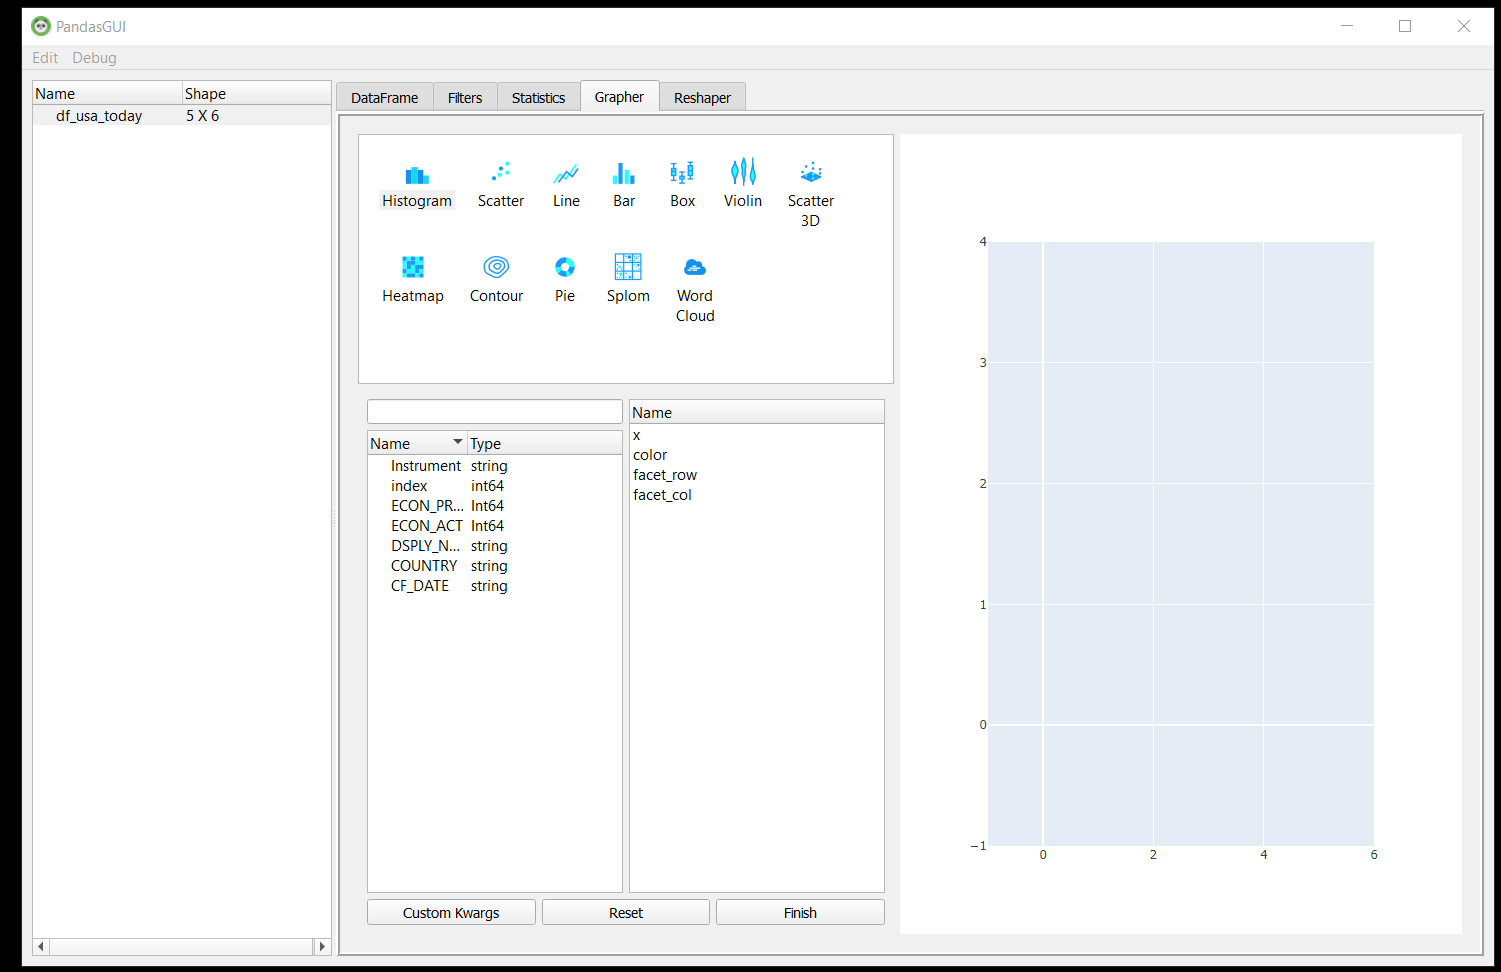
You can edit data in the selected DataFrame directly.
PandasGUI supports various types of Graphs, let's try with the Pie Chart.
You can also import and export CSV files with drag & drop, lets try to export the selected DataFrame to be a CSV file.
Getting more complex COVID-19 data
Let's continue with more complex DataFrame objects. We will use COVID-19 data (both today and historical data) of countries in RCEP (The Regional Comprehensive Economic Partnership) free trade agreement. The RCEP nations are Australia, Brunei, Cambodia, China, Indonesia, Japan, Laos, Malaysia, Myanmar, New Zealand, the Philippines, Singapore, South Korea, Thailand, and Vietnam. The 15 member countries account for about 30% of the world's population (2.2 billion people) and 30% of global GDP ($26.2 trillion) as of 2020, making it the biggest trade bloc in history.
The data that we are going to requests are the following:
- Today RCEP COVID-19 Total Cases
- Today RCEP COVID-19 New Cases
- Today RCEP COVID-19 Death Cases
- Historical Thailand COVID-19 Data (1 Year, interval daily)
- Historical RCEP COVID-19 New Cases Data (1 Year, interval daily)
- Historical RCEP COVID-19 Death Cases Data (1 Year, interval daily)
Getting a RCEP COVID-19 data
We start the code by importing Eikon Data API, Pandas, PandasGUI, and defining the required variables.
import eikon as ek
import pandas as pd
from pandasgui import show
rcep_country_code = {
'BN': 'Brunei',
'KH': 'Cambodia',
'ID': 'Indonesia',
'LA': 'Laos',
'MY': 'Malaysia',
'MM': 'Myanmar',
'PH': 'Philippines',
'SG': 'Singapore',
'TH': 'Thailand',
'VN': 'Vietnam',
'CN': 'China',
'JP': 'Japan',
'KR': 'South Korea',
'AU': 'Australia',
'NZ': 'New Zealand'
}
covid19_rics_pattern = {
'CCOV=ECI': 'Total Cases',
'NCOV=ECI': 'New Cases',
'RCOV=ECI': 'Recover Cases',
'ACOV=ECI': 'Active Cases',
'DCOV=ECI': 'Death Cases'
}
# RCEP Countries Covid-19 total cases
rics_rcep_total_cases = ['BNCCOV=ECI','KHCCOV=ECI','IDCCOV=ECI','LACCOV=ECI','MYCCOV=ECI','MMCCOV=ECI','PHCCOV=ECI','SGCCOV=ECI','THCCOV=ECI','VNCCOV=ECI','CNCCOV=ECI','JPCCOV=ECI','KRCCOV=ECI','AUCCOV=ECI','NZCCOV=ECI']
# RCEP Countries Covid-19 new cases
rics_rcep_new_cases = ['BNNCOV=ECI','KHNCOV=ECI','IDNCOV=ECI','LANCOV=ECI','MYNCOV=ECI','MMNCOV=ECI','PHNCOV=ECI','SGNCOV=ECI','THNCOV=ECI','VNNCOV=ECI','CNNCOV=ECI','JPNCOV=ECI','KRNCOV=ECI','AUNCOV=ECI','NZNCOV=ECI']
# RCEP Countries Covid-19 death cases
rics_rcep_death_cases = ['BNDCOV=ECI','KHDCOV=ECI','IDDCOV=ECI','LADCOV=ECI','MYDCOV=ECI','MMDCOV=ECI','PHDCOV=ECI','SGDCOV=ECI','THDCOV=ECI','VNDCOV=ECI','CNDCOV=ECI','JPDCOV=ECI','KRDCOV=ECI','AUDCOV=ECI','NZDCOV=ECI']
Next, we start these "complex" data requests with RCEP today Total cases COVID-19 data.
df_rcep_total_cases, err = ek.get_data(rics_rcep_total_cases, fields)
if err is None:
print('Example RCEP COVID-19 Total Cases Today Data:')
print(df_rcep_total_cases.head())
The example RCEP today COVID-19 data total cases DataFrame default result is the following:
Instrument COUNTRY CF_DATE ECON_ACT ECON_PRIOR
0 BNCCOV=ECI BRN 2021-01-13 174 174
1 KHCCOV=ECI KHM 2021-01-13 398 392
2 IDCCOV=ECI IDN 2021-01-13 858043 846765
3 LACCOV=ECI LAO 2021-01-13 41 41
4 MYCCOV=ECI MYS 2021-01-13 144518 141533
You will see that the result is straightforward but it is hard to read, so we will add country detail to the DataFrame as a new column named "Description".
# Get a List of readable Country Name and Event for adding new DataFrame column
def get_events_descriptions(list_rics):
list_result = []
for ric in list_rics:
country_code = ric[:2]
event = ric[2:]
list_result.append('{country} {event}'.format(country = rcep_country_code[country_code], event = covid19_rics_pattern[event]))
return list_result
# Add 'Description' column (example value: 'Thailand Total Cases', etc.)
df_rcep_total_cases['Description'] = get_events_descriptions(rics_rcep_total_cases)
print('DataFrame after added Description column')
print(df_rcep_total_cases.head())
The result of this DataFrame object is the following:
Instrument COUNTRY CF_DATE ECON_ACT ECON_PRIOR Description
0 BNCCOV=ECI BRN 2021-01-13 174 174 Brunei Total Cases
1 KHCCOV=ECI KHM 2021-01-13 398 392 Cambodia Total Cases
2 IDCCOV=ECI IDN 2021-01-13 858043 846765 Indonesia Total Cases
3 LACCOV=ECI LAO 2021-01-13 41 41 Laos Total Cases
4 MYCCOV=ECI MYS 2021-01-13 144518 141533 Malaysia Total Cases
Next, we continue to request RCEP today COVID-19 New and Death cases data.
df_rcep_new_cases, err = ek.get_data(rics_rcep_new_cases, fields)
# Add 'Description' column (example value: 'Thailand New Cases', etc.)
df_rcep_new_cases['Description'] = get_events_descriptions(rics_rcep_new_cases)
# RCEP Countries Covid-19 death cases
df_rcep_death_cases, err = ek.get_data(rics_rcep_death_cases, fields)
# Add 'Description' column (example value: 'Thailand Death Cases', etc.)
df_rcep_death_cases['Description'] = get_events_descriptions(rics_rcep_death_cases)
We will keep those df_rcep_total_cases, df_rcep_new_cases, and df_rcep_death_cases Dataframe variables for passing to the PandasGUI later. The next step is requesting RCEP countries' COVID-19 historical data.
df_rcep_historical_total_cases = ek.get_timeseries(rics_rcep_total_cases, start_date='2020-01-01', end_date='2021-01-12', interval='daily')
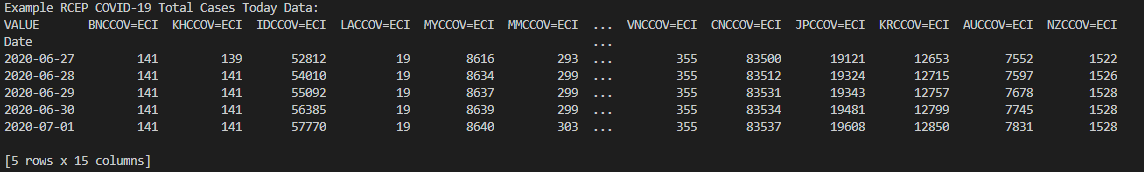
print('Example RCEP COVID-19 Total Cases Today Data:')
print(df_rcep_historical_total_cases.head())
The example DataFrame result is the following:
Then we modify the DataFrame columns' names to make them more readable.
# Get a Dictionary of readable Country Name and Event for replacing DataFrame column names
def get_events_columns(list_rics):
dict_result = {}
for ric in list_rics:
country_code = ric[:2]
event = ric[2:]
dict_result[ric] = '{country} {event}'.format(country = rcep_country_code[country_code], event = covid19_rics_pattern[event])
return dict_result
# Change RIC column names to be readable values (example value: 'Thailand New Cases', etc.)
df_rcep_historical_total_cases.rename(columns=get_events_columns(rics_rcep_total_cases), inplace = True)
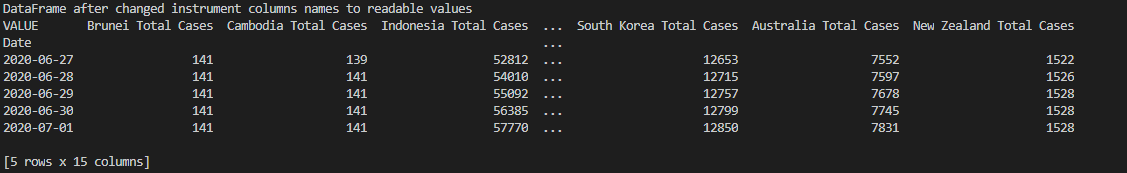
print('DataFrame after changed instrument columns names to readable values')
print(df_rcep_historical_total_cases.head())
The result is the following:
Next, we continue requesting RCEP COVID-19 history data of New and Death Cases since last year.
df_rcep_historical_new_cases = ek.get_timeseries(rics_rcep_new_cases, start_date='2020-01-01', end_date='2021-01-12', interval='daily')
# Change RIC column names to be readable values (example value: 'Thailand New Cases', etc.)
df_rcep_historical_new_cases.rename(columns=get_events_columns(rics_rcep_new_cases), inplace = True)
df_rcep_historical_death_cases = ek.get_timeseries(rics_rcep_death_cases, start_date='2020-01-01', end_date='2021-01-12', interval='daily')
# Change RIC column names to be readable values (example value: 'Thailand New Cases', etc.)
df_rcep_historical_death_cases.rename(columns=get_events_columns(rics_rcep_death_cases), inplace = True)
Some DataFrame cells data maybe contain a missing value, we need to replace those cells with **0** integer value to make the DataFrame can be plotted.
# Fill missing value as 0
df_rcep_historical_total_cases.fillna(0 ,inplace = True )
df_rcep_historical_new_cases.fillna(0 ,inplace = True )
df_rcep_historical_death_cases.fillna(0 ,inplace = True )
Passing Multiple RCEP COVD-19 DataFrame objects to PandasGUI
We can pass multiple DataFrame objects to PandasGUI with show(**kwargs) function by sending these DataFrame objects as Python Dictionary object.
# Create Data Dictionary to sends all DataFrame objects to PandasGUI
dataset = {
'RCEP Today Total Cases': df_rcep_total_cases,
'RCEP Today New Cases': df_rcep_new_cases,
'RCEP Today Death Cases': df_rcep_death_cases,
'RCEP Historical Total Cases': df_rcep_historical_total_cases,
'RCEP Historical New Cases': df_rcep_historical_new_cases,
'RCEP Historical Death Cases': df_rcep_historical_death_cases,
}
# Display all DataFrame objects in PandasGUI
show(**dataset)
The PandasGUI application will show as a separate application.
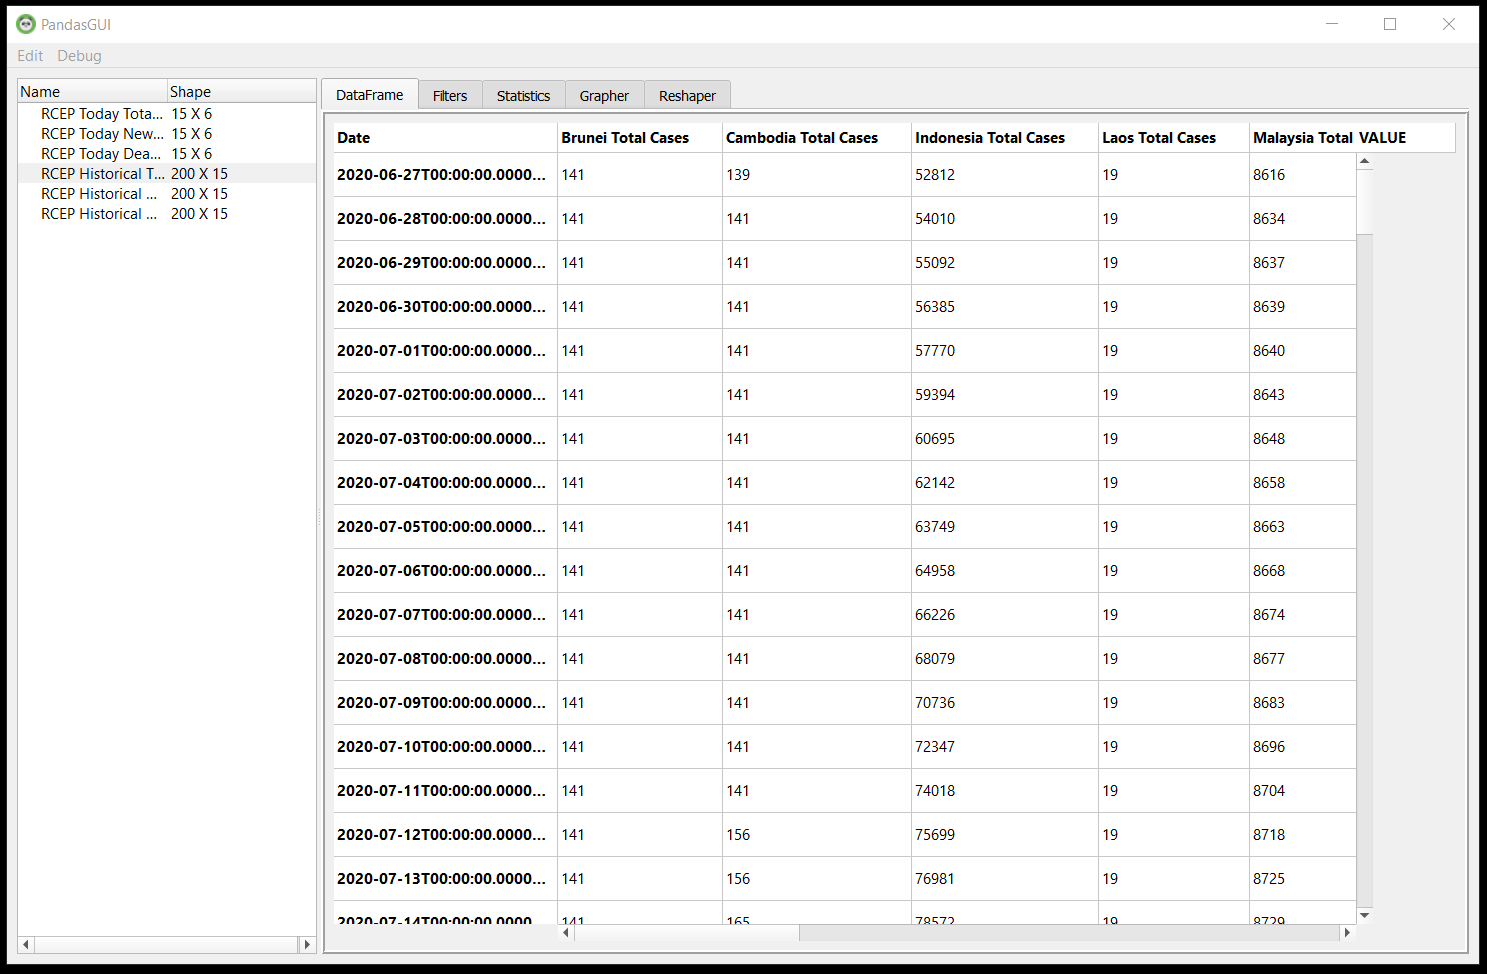
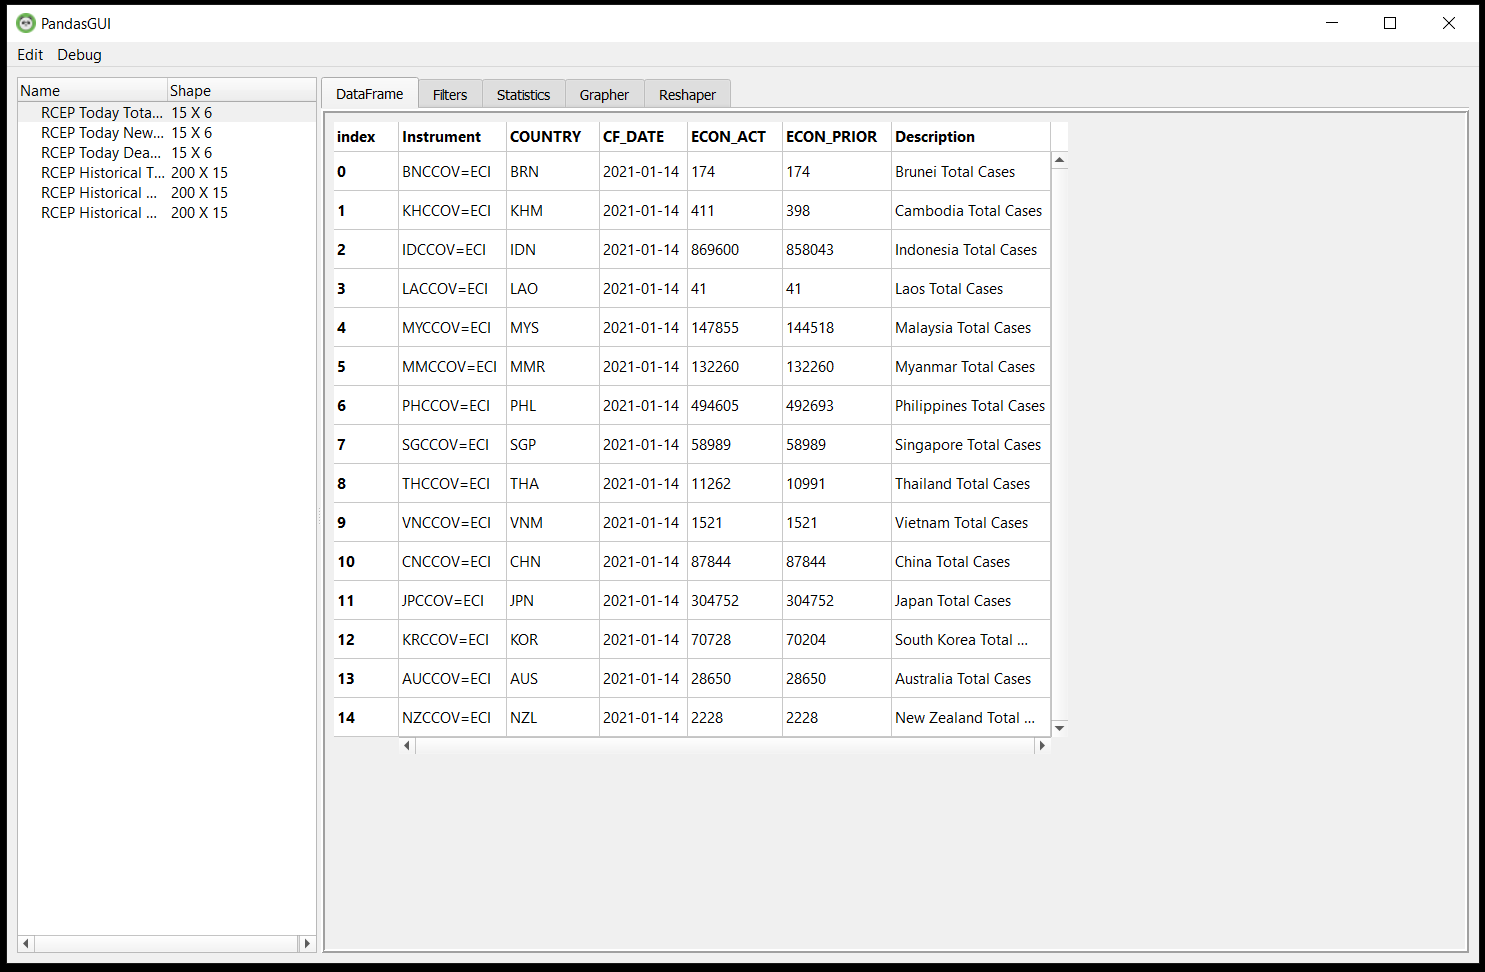
You can interact with each DataFrame in the PandasGUI by selecting interested DataFrame in the left panel.
Let's try plotting graphs for today and historical data.
The Statistic and Filter tabs also help you analyze the selected DataFrame easily.
How to run the example
Please note that the Refinitiv Workspace/Eikon application integrates a Data API proxy that acts as an interface between the Eikon Data API Python library and the Eikon Data Platform. For this reason, the Refinitiv Workspace/Eikon application must be running when you use the Eikon Data API Python library.
Please unzip or download the example application from GitHub into a directory of your choosing, and then follow the step-by-step instruction in How to run this example section of the project README.md file.
Conclusion
PandasGUI tool provides a simple GUI interface that helps Data Scientists analyze data without requiring a great Python/Pandas programming skill. Data Scientists can just get the data and use the tool for data exploratory, creating simple visualize data, or exporting data to a CSV file. The PandasGUI tool lets everybody access Pandas built-in functions via the GUI which is suitable for a wide range of programming skills. The casual developers/data scientists can use PandasGUI as a starting tool for data analysis while the professional developers can use this tool for quick data checking. Please note that PandasGUI is under active development, we might see some more features in the coming days.
At the same time, the Eikon Data API lets developers rapidly access Refinitiv Eikon/Refinitiv Workspace data and our latest platform capabilities with a few lines of code that easy to understand and maintain.
References
You can find more detail regarding the PandasGUI, Eikon Data APIs, and related technologies from the following resources:
- Refinitiv Eikon Data API page on the Refinitiv Developer Community web site.
- PandasGUI GitHub page.
- PandasGUI PyPi page.
- PandasGUI: GUI interface for Pandas Library
- PandasGUI: Analyzing Pandas DataFrame with a Graphical User Interface
- Eikon Data API Quick Start Guide page.
- Eikon Data API Tutorial page.
- Python Quants Video Tutorial Series for Eikon API.
- Eikon Data APY Python Reference Guide.
- Eikon Data API Troubleshooting article.
- Get Corona Virus Cases Latest And Time-series Statistic with Eikon Data API(Python) example
For any question related to this example or Eikon Data API, please use the Developers Community Q&A Forum.