
Have you ever want to know the following information on the production system?
- Call stack when the function is called
- The elapsed time used by the functions
- The values of parameters passed to the functions
- The return values of the functions
- The functions’ call trace
- OS behaviors
Overview
DTrace is an exhaustive dynamic tracing toolkit officially introduced in Sun Solaris 10 in January 2005. It is designed to dynamically and safely inspect the behavior of the operating system’s kernel and applications on any environments including development, testing, and production. Therefore, it is a very efficient tool to investigate issues inside the operating system and running applications. At the time of this writing, DTrace has been ported to many operating systems including Oracle Linux, macOS, FreeBSD, and Windows 10 insider builds.
This article only focuses on using DTrace on Oracle Linux.
DTrace on Oracle Linux
Oracle acquired Sun Microsystems in 2010. On December 12, 2012, Oracle officially announced the general availability of DTrace for Oracle Linux. Currently, DTrace supports the Unbreakable Enterprise Kernel (UEK) release 4 or release 5. Support for DTrace on UEK3 has been discontinued. The following table is from Oracle Linux and Unbreakable Enterprise Kernel (UEK) Releases representing the associations between support UEKs and Oracle Linux releases.
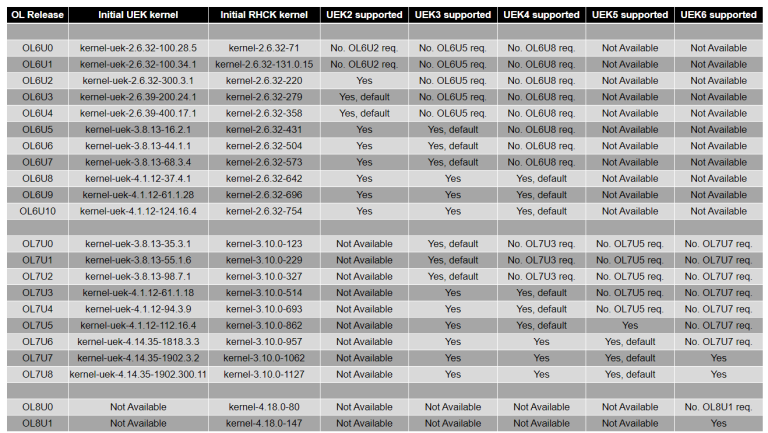
In this article, Oracle Linux 7 Update 7 (UEK5) is used for demonstration.
The following command can be used to install DTrace on Oracle Linux 7.
# yum install dtrace-utils
Then, you can run the following command to test DTrace.
# dtrace -ln 'pid$target:::entry' -c "ls"
ID PROVIDER MODULE FUNCTION NAME
13021 pid2278 ld-linux-x86-64.so.2 print_statistics entry
13022 pid2278 ld-linux-x86-64.so.2 init_tls entry
13023 pid2278 ld-linux-x86-64.so.2 is_trusted_path_normalize entry
13024 pid2278 ld-linux-x86-64.so.2 oom entry
13025 pid2278 ld-linux-x86-64.so.2 update_get_addr entry
13026 pid2278 ld-linux-x86-64.so.2 check_one_fd.part.0 entry
The above DTrace command uses the pid provider to probe the ls command. For more information, please refer to the Oracle Linux DTrace Guide.
The D Programming Language
To use DTrace, users need to create a D program with the D programming language for defining probe locations, conditions, and actions. Then, the source files will be compiled and sent into the operating system kernel for execution by DTrace. The syntax of the D programming language is very similar to C with its built-in variables and functions.
D programs consist of a set of clauses executed in order. Each clause describing one or more probes to be enabled, an optional predicate to check a condition before fired, and an optional set of actions to perform when the probe is fired.
Probe descriptions
/Predicate/
{
Action statements
}
Probe descriptions
Probe descriptions list probes enabled in the clause. Multiple probe descriptions are separated by commas. Each probe can be identified by using a unique probe ID or a human-readable name. The human-readable name comprises of four parts (provider:module:function:name). The module, function, and name fields can be blank to match any of its probes. Probe descriptions also support pattern matching characters, such as * (match any string), and ? (match any single character).
To list all available probes, the following command can be used:
# dtrace -l
ID PROVIDER MODULE FUNCTION NAME
1 dtrace BEGIN
2 dtrace END
3 dtrace ERROR
…
18 syscall vmlinux read entry
19 syscall vmlinux read return
20 syscall vmlinux write entry
…
4865 lockstat dm_mod run_io_job spin-release
4866 lockstat dm_mod dm_kvzalloc spin-release
4867 lockstat dm_mod dm_stats_create spin-release
4868 perf dm_mod map_request block_rq_remap
…
17095 pid2278 libselinux.so.1 security_av_string entry
17096 pid2278 libselinux.so.1 print_access_vector entry
Predicate
A predicate is an expression enclosed in slashes. It is evaluated at probe firing time to determine if the associated actions should be executed. If the predicate evaluates to true (non-zero value), the action statements will be executed. Otherwise, the probe firing will be ignored.
Action Statements
The actions are listed as a series of statements enclosed in braces { } following the probe name or predicate. Each statement ends with a semicolon (;). D programming language is derived from a large subset of C combined with a special set of functions and variables. It has built-in support for associative array and string variables. Unlike C, it doesn’t support conditional (if) and loop (for) control flow but it supports conditional expressions through the ? and : operators. Moreover, the explicit variable declaration is not required.
Sample Usages
This section demonstrates DTrace sample programs used to monitor behaviors of EMA consumer example applications.
Measuring update rate per second (UpdateRate.d)
One method to determine performance of consuming applications is measuring the number of update messages that the applications can handle per second. The more update rate the application can handle, the higher performance the application has.
DTrace can be used to determine the update rate that the consuming applications can handle at run time. The program looks like:
BEGIN
{
updateCount = 0;
}
pid$1::*ItemCallbackClient*processRefreshMsg*:entry,
pid$1::*ItemCallbackClient*processUpdateMsg*:entry
{
updateCount++;
}
profile:::tick-1sec
/updateCount > 0/
{
printf("%Y: Number of Updates per second: %d\n", walltimestamp, updateCount);
@average["Average Update Rate"] = avg(updateCount);
@max["Max Update Rate"] = max(updateCount);
@min["Min Update Rate"] = min(updateCount);
updateCount = 0;
}
This program has three clauses. The first clause uses the BEGIN probe which is fired before any other probes. When fired, it sets the global updateCount variable to zero.
The second clause uses probes from the pid provider. $1 after the pid provider is a built-in variable representing the first parameter passed to the DTrace command when running this program. It is a process ID of the consuming application. This clause sets probes at the entry point of the ItemCallbackClient::processRefreshMsg and ItemCallbackClient::processUpdateMsg methods in the EMA code. These EMA methods are used to process refresh and update messages. When fired, it increases the value of the global updateCount variable by one. This updateCount variable represents a number of the processed refresh and update messages.
The last clause uses a timer probe from the profile provider. This probe will be fired every second. This clause has a predicate so it is fired when the value of the updateCount variable is more than zero. When fired, the value of the updateCount will be printed to the output. It also uses the aggregate functions to calculate the average, maximum, and minimum of the updateCount values. The average, maximum, and minimum values are printed when the DTrace program exits.
Use the following command to run this DTrace program.
dtrace -q -s UpdateRate.d <pid>
<pid> is the process ID of the running consuming application.
The output will show the number of messages that the application can process per second. When the application exits with Ctrl+c, it will show the average, maximum, and minimum numbers of messages processed per second.
# dtrace -q -s UpdateRate.d `pgrep Cons100`
2020 Apr 13 11:35:16: Number of Updates per second: 9847
2020 Apr 13 11:35:17: Number of Updates per second: 10770
2020 Apr 13 11:35:18: Number of Updates per second: 9517
2020 Apr 13 11:35:19: Number of Updates per second: 10469
2020 Apr 13 11:35:20: Number of Updates per second: 9626
2020 Apr 13 11:35:21: Number of Updates per second: 9104
2020 Apr 13 11:35:22: Number of Updates per second: 11270
2020 Apr 13 11:35:23: Number of Updates per second: 9875
2020 Apr 13 11:35:24: Number of Updates per second: 10139
…
2020 Apr 13 11:35:42: Number of Updates per second: 9980
Average Update Rate 10021
Max Update Rate 11270
Min Update Rate 9104
Slow Consumer Detection (WindowSize.d)
When applications have issues, such as disconnections, missing updates, and delayed data, the cause of these problems might be slow consumers. A slow consumer issue happens when an application is unable to process all the messages on time. It is taking too long to process each message it receives and therefore, it is building up a backlog on the server. At some point, the server will cut connections of slow consumer applications.
Typically, the slow consumer issue can be detected by the following methods.
1. Verify the server log. Typically, when the server cuts the client connection due to the slow consumer issue, it will add the following log into the log file. Therefore, if you see this log on the server, it might indicate that the connected client applications could be slow consumers.
xxx user at position xxx on host xxx using application on channel xxx has been disconnected due to an overflow condition.
2. Use package analysis tools, such as tcpdump or Wireshark to verify the TCP receive window size of consuming applications. If the application is a slow consumer, the size of the TCP receive window will drop nearly or equally to zero. The below line graph represents the size of TCP receive changed over time. There are some periods that the TCP receive window size drops to zero. This indicates that the application could be a slow consumer.
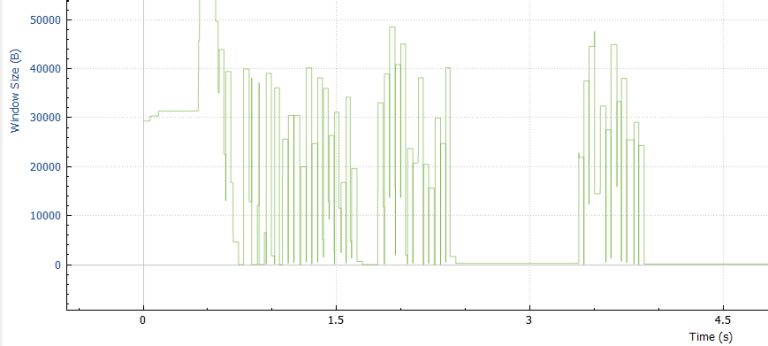
Instead of running package analysis tools, DTrace can also be used to verify the TCP receive window size.
tcp::*tcp_transmit_skb:send
/pid == $1 && args[3]->tcps_rport == 14002/
{
@stats["Recv Window"] = quantize(args[3]->tcps_rwnd);
}
profile:::tick-10sec
{
printa(@stats);
}
END
{
printa(@stats);
}
This program has three clauses. The first clause uses the tcp_transmit_skb:send probe from the TCP provider. It is fired when the TCP forwards the data to the IP layer. This probe has five arguments.
| Variable Name | Type | Description |
|---|---|---|
| args[0] | pktinfo_t * | packet information |
| args[1] | csinfo_t * | connection information |
| args[2] | ipinfo_t * | IP protocol information |
| args[3] | tcpsinfo_t * | TCP state information |
| args[4] | tcpinfo_t * | TCP header information |
This clause uses the args[3] variable to get the TCP state information of the monitored process. It uses a predicate to evaluate the value of process ID and remote TCP port (tcps_rport). The associated actions will be executed when the value of process ID is equal to the first parameter passed to the DTrace command and the TCP remote port is equal to 14002 which is a default TCP port of RSSL connection. When fired, it uses an aggregate function (quantize) to collect the TCP receive window size (tcps_rwnd) from the TCP state information. The quantize function calculates a power-of-two frequency distribution of the TCP receive window size.
The second clause uses a timer probe from the profile provider. This probe will be fired every 10 seconds. When it is fired, it calls the printa function to print the result of the quantize function.
The last clause uses the END probe which is fired when the DTrace program exits. This clause also calls the printa function to print the result of the quantize function.
Use the following command to run this DTrace program.
dtrace -q -s WindowSize.d <pid>
<pid> is the process ID of the running consuming application.
The output when the application is not a slow consumer looks like:
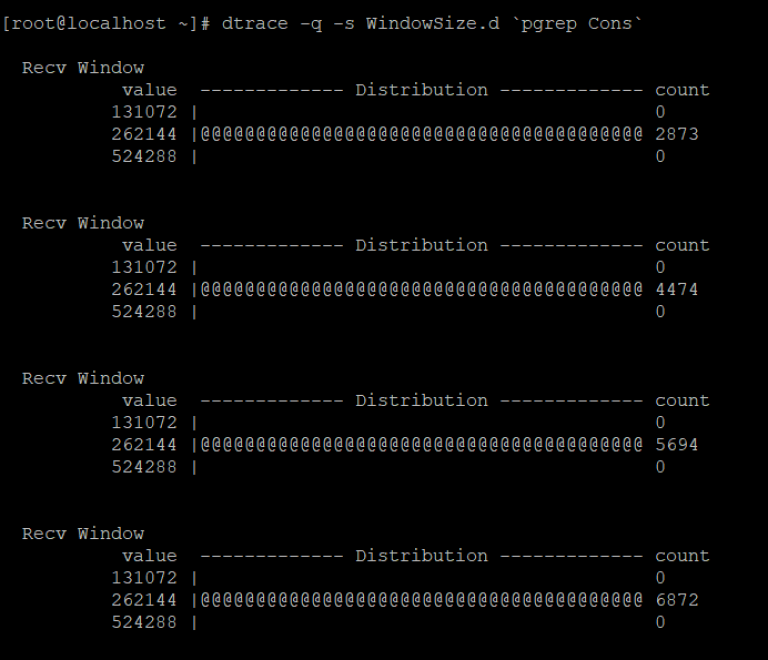
From the output, the TCP receive window size is stable around 262144 bytes.
However, when the application is a slow consumer, the output looks like:
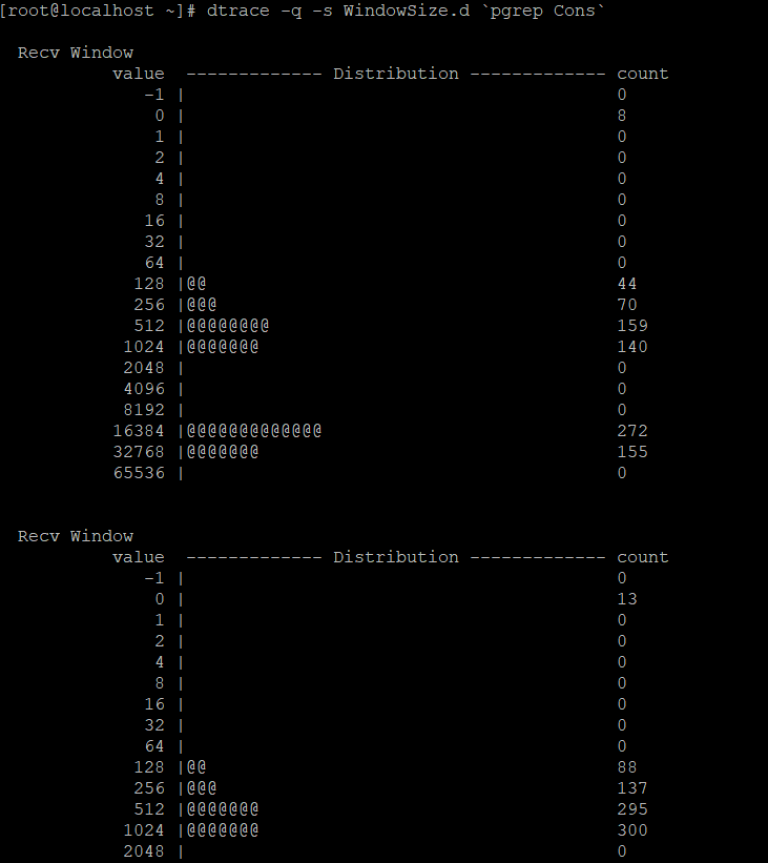
The distribution statistic indicates that the TCP receive window size is unstable and sometimes it drops to zero. This indicates that the application could be a slow consumer.
Summary
DTrace is a tool for dynamically inspecting the behaviors of the operating system’s kernel and applications in any environment, especially the production environment. Currently, DTrace is supported by many operating systems, such as Oracle Solaris, Oracle Linux, macOS, FreeBSD, and Windows 10 insider builds. To use DTrace, we need to use the D programming language to create DTrace programs defining probe descriptions, predicates, and action statements. Then, run the programs with the DTrace command to probe applications or operating systems.
References
- Dtrace.org. 2008. Aggregations - Dynamic Tracing Guide. [online] Available at: http://dtrace.org/guide/chp-aggs.html [Accessed 17 April 2020].
- Coter, S., 2018. Oracle Linux And Unbreakable Enterprise Kernel (UEK) Releases. [online] Blogs.oracle.com. Available at: https://blogs.oracle.com/scoter/oracle-linux-and-unbreakable-enterprise-kernel-uek-releases [Accessed 17 April 2020].
- En.wikipedia.org. n.d. Dtrace. [online] Available at: https://en.wikipedia.org/wiki/DTrace [Accessed 17 April 2020].
- Koch, Z., 2012. Announcement: Dtrace For Oracle Linux General Availability. [online] Blogs.oracle.com. Available at: https://blogs.oracle.com/linux/announcement%3a-dtrace-for-oracle-linux-general-availability [Accessed 17 April 2020].
- Marsden, G., 2018. Tracing Linux Networking With Dtrace On Oracle Linux. [online] Blogs.oracle.com. Available at: https://blogs.oracle.com/linux/tracing-linux-networking-with-dtrace-on-oracle-linux-v2 [Accessed 17 April 2020].
- Mauerer, W., 2008. Professional Linux Kernel Architecture (Wrox Professional Guides). Wrox.
- Oracle.com. n.d. Oracle Linux Dtrace. [online] Available at: https://www.oracle.com/linux/downloads/linux-dtrace.html [Accessed 17 April 2020].
- Docs.oracle.com. 2019. Oracle® Linux Dtrace Guide. [online] Available at: https://docs.oracle.com/en/operating-systems/oracle-linux/dtrace-guide [Accessed 17 April 2020].
- Docs.oracle.com. 2019. Oracle® Linux Dtrace Tutorial. [online] Available at: https://docs.oracle.com/en/operating-systems/oracle-linux/dtrace-tutorial/ [Accessed 17 April 2020].
- Pulpaka, H., 2019. Dtrace On Windows. [online] Microsoft Tech Community. Available at: https://techcommunity.microsoft.com/t5/windows-kernel-internals/dtrace-on-windows/ba-p/362902 [Accessed 17 April 2020].
- Seth, S. and Venkatesulu, M., 2008. TCP/IP Architecture, Design And Implementation In Linux. Hoboken: Wiley.
- Docs.oracle.com. 2014. Tcp Provider - Oracle® Solaris 11.2 Dynamic Tracing Guide. [online] Available at: https://docs.oracle.com/cd/E36784_01/html/E36846/glhmv.html [Accessed 17 April 2020].