

Coined in 1933, the first 100 days is sometimes used to measure the successes and accomplishments of a first-term president during the time that their power and influences are at their greatest. Approval rates are largely taken from polls and surveys where the results are typically measured based on their performance. Criteria such as the decisions made, changes based on campaign promises, etc., are expected but also general perception, and overall popularity can be very influential. In addition to public opinion, how the financial markets respond during this time can be an interesting guide or measuring-stick when grading the first 100 days.
Using the power of Python and the Eikon Scripting API, the following article will outline a number of comparisons using a simple Python application to see how the market has responded to the first 100 days.
 Prerequisites
Software components used:
- Eikon Data API - Interface to access Eikon data on the desktop
- Python (3.6.1)- Python Development Environment - version 3
- Jupyter notebooks - Browser-based development environment to create equations, visualization, and explanatory text.
- ipywidgets (7.0.0) - Interactive HTML widgets for jupyter notebooks
- One time initialization:
- With pip: jupyter nbextension enable --py --sys-prefix widgetsnbextension
- With conda: conda install -c conda-forge ipywidgets
- One time initialization:
- Pandas (0.20.3) - Python Data Analysis Library
- Cufflinks (0.12.0) - Library that greatly simplifies Plotly charting
Note: This article assumes the user has successfully installed and set up their development/testing environment based on the above requirements. The links provided outline the details of the components, packages, and how to install each. In addition, we won't be spending time providing basic instructions on the Jupyter Notebook environment and its operation. It is assumed you have basic familiarity.
Overview
When measuring the performance of any given president, we can apply multiple scenarios that may be interesting and possibly support approval ratings. For example, during the first 100 days of President Donald Trump, we can show how the Currency markets responded. How did the US Dollar and Mexican Peso compare while Trump was in office? Were the world indices affected differently? In addition, it would also be interesting to determine how multiple presidents compared to each other. Did President Obama have any noticeable effect vs president Kennedy? Using the power of Python's modules to organize and chart complex data sets coupled with Refinitiv's ability to easily access this historical content, we can find these answers fairly easily.
Let's try out a few scenarios.
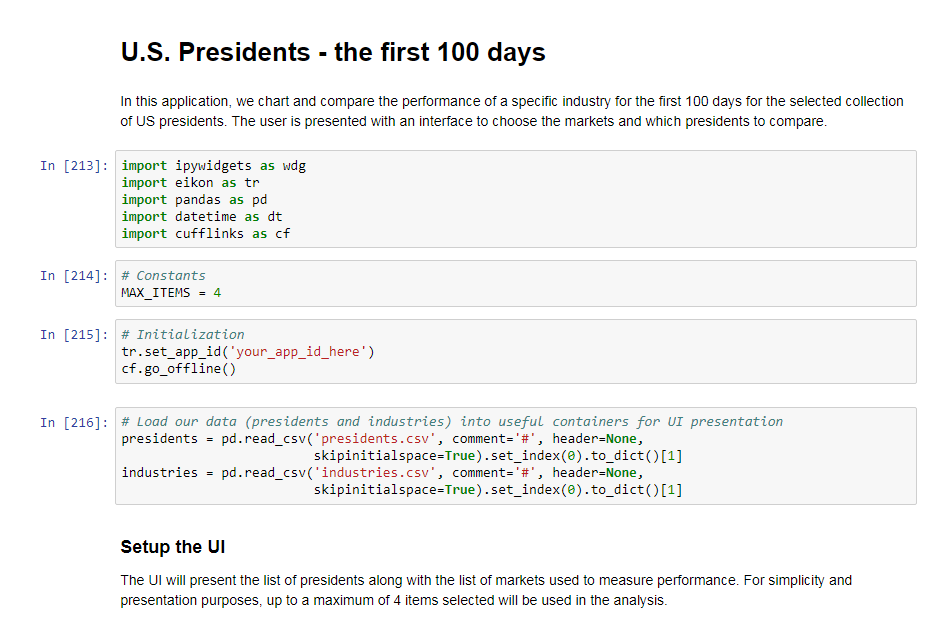
Setup
Before we begin playing with different scenarios, let's first establish our setup. As outlined within the Prerequisite section, once a basic environment has been defined, you can grab the application code from the GitHub repository.
The application package includes the following:
- USPresidents_100Days.ipynb
The Jupiter Notebook document represents an example containing the core Python instructions to execute our application. All the input data is driven from simple text files allowing the user to easily add additional values.
- presidents.csv
The presidents' file is a collection of (name, date) pairs where the date value represents the inauguration date of their first term:
Donald J Trump, 2017-01-20
Barack Obama, 2009-01-20
George W. Bush, 2001-01-20
- industries.csv
The industries file contains a collection of (name,ric) pairs where the ric is the Reuters Instrument Code representing the market of interest:
Equity: Dow Jones, .DJI
Equity: Mkt Volatility, .VIX
Currency: USD $, =USD
Running the application
The application is executed within the Jupyter notebooks web-based environment. Prior to running the application, ensure you have launched your Eikon API Proxy - a component packaged with the Eikon Web and Scripting API bundle.
To run the application, let's load up Notebook:
> cd <directory of the downloaded package>
> jupyter notebook
Within your browser, load up the USPresidents_100Days.ipynb application:
Once loaded, you can start by stepping through the code segments to reach the point where the UI is presented for your input selection.
Scenario 1 - Donald Trump - Effect on Currencies
According to this Business Insider article, prior to Trump's inauguration, stocks were on a tear. During this same timeframe, it was clear how his much-publicized rhetoric triggered Currencies in a big way. As we learned from that article, between Nov 7th, 2016, and Jan 5th, 2017, the Russian Ruble gained 7.7% against the US Dollar while the Mexican Peso lost 13.4% - supposedly largely due to market reaction to the president-elect’s social media comments. Let’s take a look at how these currencies faired against the USD during President Trump’s first 100 days in the office.
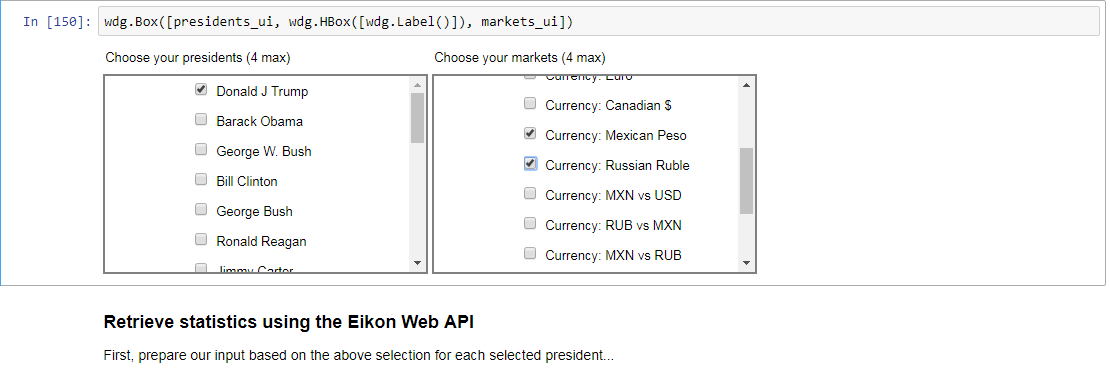
First, select our input parameters from the UI:
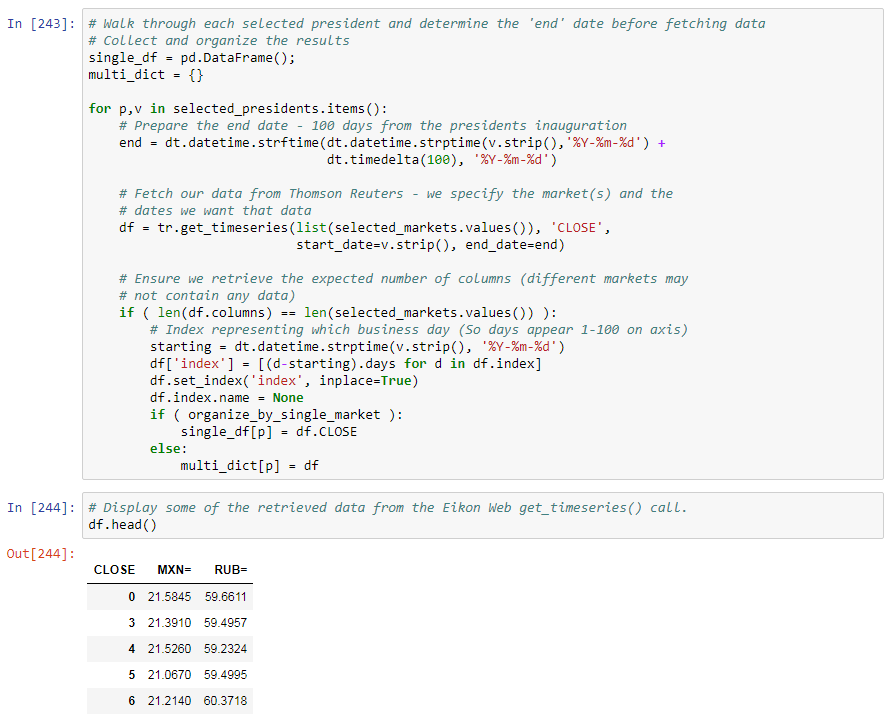
Retrieve the raw data:
We see both currencies strengthening against the USD and we see strong correlation between these two currencies. Additionally, we can see the Mexican Peso strongly outperforming the Russian Ruble.
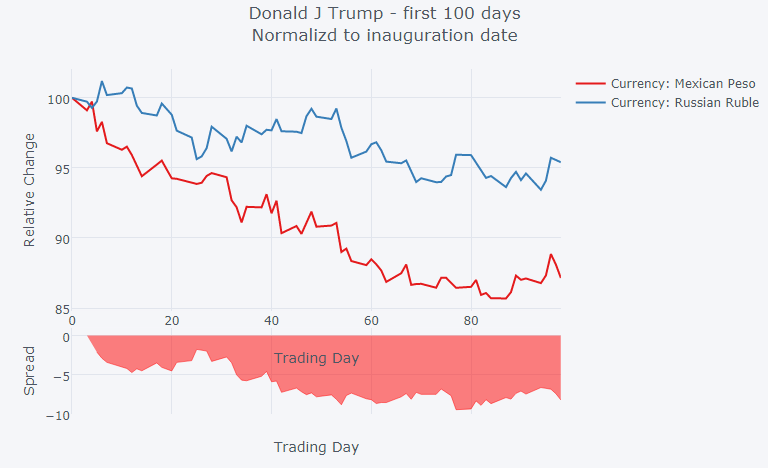
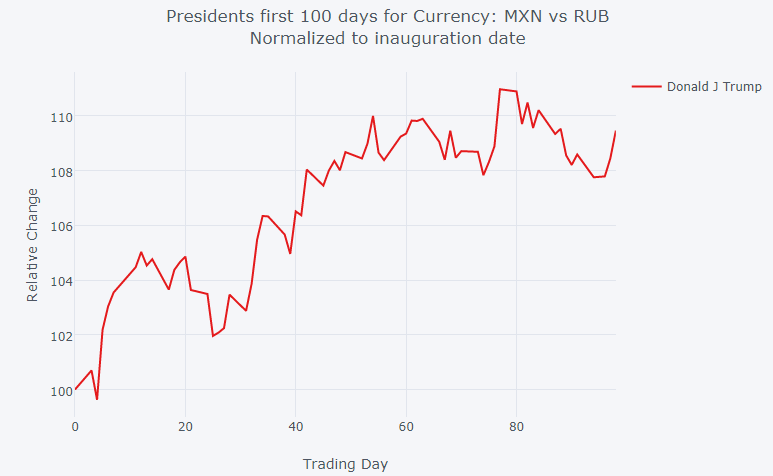
And to support the above comparison, we can utilize Refinitiv's convenient Cross Rate RICs to measure performance against 2 currencies. In our case, the instrument MXN vs RUB (MXNRUB=R) was chosen which shows the Mexican Peso outperforming the Russian Ruble during this time period.
Scenario 2 - Comparing multiple presidents against a given market
While using the markets to measure the performance of the first hundred days can be an indicator, it certainly isn't the only influence. Aside from the direct performance of the president during those first hundred days, many uncontrollable external events have had a great effect on the economy and market. For example, some of the presidents over the last century have had to endure such crisis as the Great Depression, the Great Recession, etc. which can significantly skew some indicators.
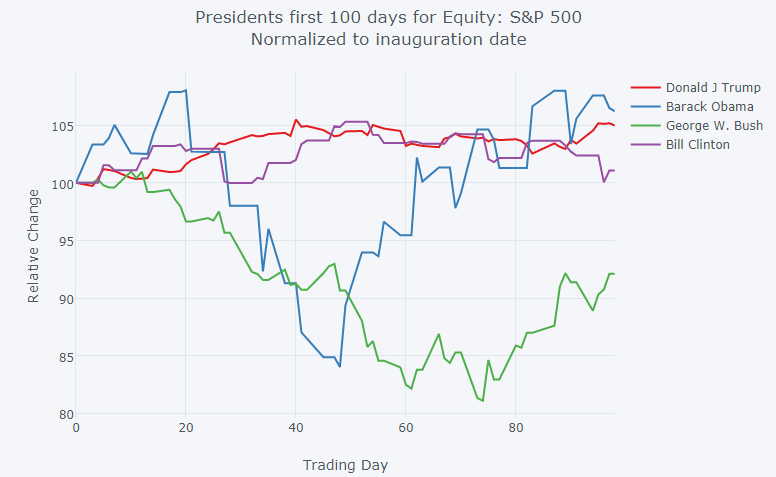
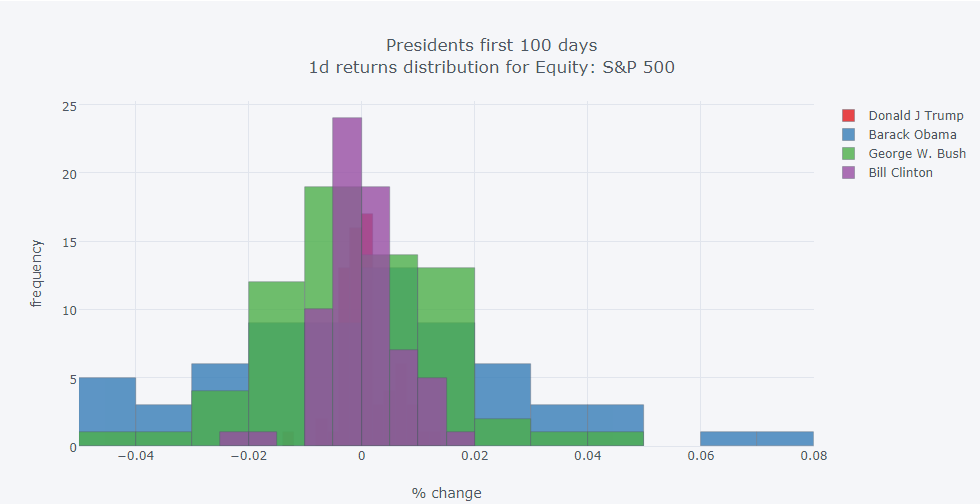
The next simple comparison we demonstrated is the comparison of multiple presidents against any given market. Let's select the last 4 presidents and compare against the S&P 500 index:
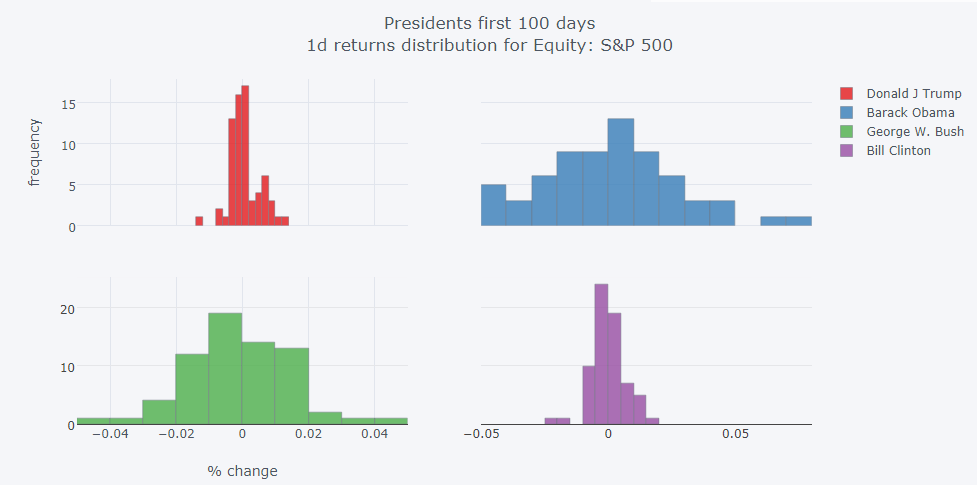
The example application also includes some additional views providing a slightly different breakdown of performance:
Next steps
There are a number of articles and papers published over the years discussing the importance of the first 100 days. It is believed that many Presidents have higher success rates during the first hundred days of their first year than they do later during their first year or during the first hundred days of non-inaugural years. Feel free to satisfy your own curiosity and explore the many combinations with this simple tool.
Source Code
Related Links