

- Working knowledge of Windows, developer tools, Refinitiv RT-SDK and basic Windows + Linux command line usage.
- Completed Part 1 of this article
Introduction
Two-part article
Due to the detailed nature of this article, it has been split into two parts
- The 1st part covered the Basic installation and configuration required to get an instance of RTC running inside a Docker container (supporting basic Consumer functionality)
- This 2nd part details the additional configuration of RTC to support Providers and Posting (contributions) - as well as a brief look at the RTC monitoring tool
Assuming you have worked through part 1 and successfully started up an instance of RTC running inside a Docker Container, we can now move on to the meaty stuff.
Configuring RTC for Providers and Posting
Once I had the basic Docker install, deployment and RTC configuration out of the way, I moved onto the focus of this article – i.e., configuring the RTC to allow me to:
· Post (contribute) data to a cache service,
· test both Interactive and Non-Interactive Providers more easily,
· access some functionality normally only available to the MDS admin team
Configure RTC for a Posting Cache and NIProvider service
The first thing I added was a service that would allow me to test Post (Contributor) type applications as well as Non-Interactive provider code.
To enable the NI-Provider functionality of the RTC, I activated the RsslServer as follows (in the rtc.cnf file):
!!! RSSL
*rtc*enableRsslServer : True
*rtc*rsslServerPort : distribution_rssl_source
*rtc*distribution_rssl_source*serverToClientPings : True
*rtc*distribution_rssl_source*clientToServerPings : True
*rtc*distribution_rssl_source*pingTimeout : 30
*rtc*distribution_rssl_source*minPingTimeout : 6
*rtc*distribution_rssl_source*maxConnections : 100
*rtc*distribution_rssl_source*guaranteedOutputBuffers : 200
*rtc*distribution_rssl_source*maxOutputBuffers : 400
*rtc*distribution_rssl_source*compressionType : 0
*rtc*distribution_rssl_source*zlibCompressionLevel : 3
*rtc*distribution_rssl_source*interfaceName :
*rtc*distribution_rssl_source*reusePort : False
*rtc*distribution_rssl_source*connectionType : 0
*rtc*distribution_rssl_source*serverCert :
*rtc*distribution_rssl_source*serverPrivateKey :
In the above section, I set the first parameter to True and removed the ‘!’ comment from the remaining lines in the section.
I then defined a service called NI_PUB that I could
- Post (contribute) data from a Posting application
- Publish data to from a NIProvider application:
!!! Non-interactive Cache for Posting + NIPROV
*rtc*cacheServiceList : NI_PUB
*rtc*NI_PUB*cacheLocation : ssl
*rtc*NI_PUB*cacheType : sourceDriven
*rtc*NI_PUB*maxCache : 50000
*rtc*NI_PUB*domainsCached : ALL
*rtc*NI_PUB*capabilityList : 6, 7, 8, 9, 10
*rtc*NI_PUB*buildCacheFromUpdates : False
*rtc*NI_PUB*markItemsOkOnUpdate : False
*rtc*NI_PUB*forwardPostUserInfo : False
*rtc*NI_PUB*dumpAccessLockFileName :
*rtc*NI_PUB*dumpAuditUserInfoFileName :
*rtc*NI_PUB*convertMfeedDataToRWF : False
*rtc*NI_PUB*validateMfeedToRWFConvForPosts : False
*rtc*NI_PUB*enableOverrideInsertRecordResp : False
*rtc*NI_PUB*overrideClearCache : False
Once I saved the above changes to my rtc.cnf file, I restarted my RTC container – either via the Docker Dashboard or from the command line e.g.
C:>docker restart rtc
Where rtc is the container name – as defined in the yml file.
To test if the above changes were valid, I used an EMA Posting example and NIProvider example.
NOTE: For all the test scenarios below, I am using EMA C++ examples - the same tests can be done with EMA Java – by making similar changes to the equivalent EMA Java example. Likewise, ETA developers should also be able to perform similar testing with the appropriate changes to the equivalent ETA examples.
Testing the Post (contribution) functionality
For a Posting test, we can use the EMA example 341_MP_OffStreamPost with the following changes in the main() and onRefreshMsg() methods:
// changed to main() method
UInt64 handle = consumer.registerClient( ReqMsg().domainType( MMT_MARKET_PRICE )
.serviceName( "NI_PUB" ).name( "MYTEST.RIC" ), client, closure );
// changes to onRefreshMsg() method:
_pOmmConsumer->submit( PostMsg().postId( postId++ ).serviceName( "NI_PUB" )
.name( "MYTEST.RIC" ).solicitAck( true ).complete().payload(
RefreshMsg().payload(FieldList().addReal(25,35,OmmReal::ExponentPos1Enum ).complete())
.complete() ), ommEvent.getHandle() );
Once you build and run the example, you should some output like:
Received: AckMsg
Item Handle: 1999905924208
Closure: 0000000000000001
Item Name: not set
Service Name: not set
Ack Id: 1
Received: RefreshMsg
Handle: 1999902871904 Closure: 0000000000000001
Item Name: MYTEST.RIC
Service Name: NI_PUB
Item State: Open / Ok / None / ''
Name: ASK Value: 350
As you will note, we first get
· the AckMsg acknowledging the Post was accepted by the RTC server
· then we see the RefreshMsg confirming that the MYTEST.RIC subscription request to the RTC server was successful
· and the payload has ASK field as per the Post message we submitted earlier.
NOTE: As a reader rightly pointed out - the first time you test the Posting functionality described above, you may see an 'F10 - Not in Cache' error. This would be the case if the RIC you are contributing does not yet exist (and in the main() method we make a subscription request for it).
Test the NI-Provider functionality
For the NIProvider testing, we can use any of the EMA NIProvider examples such as 100_MP_Streaming - from the NIProvider folder (– not Consumer folder).
The example as provided should already have the host set to localhost:14003 and the service name should be set to NI_PUB in the source code.
If you run the NIProv100 example, you should see some warnings about missing Dictionary configuration, followed by something like:
loggerMsg
TimeStamp: 16:11:17.744
ClientName: ChannelCallbackClient
Severity: Success
Text: Received ChannelUp event on channel Channel_7
Instance Name Provider_1_1
Connected component version: rtc3.5.3.L1.linux.rrg 64-bit
loggerMsgEnd
The above message confirms that the NIProvider successfully connected to the RTC instance. The example will then run for around 60 seconds publishing updates to the RTC server before exiting. To see some evidence that the data is really being published, we will need to fire up a Consumer example connecting to the RTC and subscribing to the service and instrument name as used by the NIProvider.
We can re-use the Consumer example 100_MP_Streaming example – just change the service and instrument name as follows:
consumer.registerClient( ReqMsg().serviceName("NI_PUB").name("IBM.N"), client );
If you then run NIProv100 in one console and Cons100 in a 2nd console, you should see Cons100 receiving a Refresh and Updates for IBM.N from NI_PUB
>Cons100
RefreshMsg
streamId="5"
name="IBM.N"
serviceName="NI_PUB"
Payload dataType="FieldList"
FieldList FieldListNum="0" DictionaryId="0"
FieldEntry fid="22" name="BID" dataType="Real" value="33.94"
FieldEntry fid="25" name="ASK" dataType="Real" value="39.94"
FieldEntry fid="30" name="BIDSIZE" dataType="Real" value="13"
FieldEntry fid="31" name="ASKSIZE" dataType="Real" value="19"
FieldListEnd
PayloadEnd
RefreshMsgEnd
UpdateMsg
streamId="5"
name="IBM.N"
serviceId="10000"
serviceName="NI_PUB"
Payload dataType="FieldList"
FieldList
FieldEntry fid="22" name="BID" dataType="Real" value="33.95"
FieldEntry fid="30" name="BIDSIZE" dataType="Real" value="14"
FieldListEnd
PayloadEnd
UpdateMsgEnd
Configure for Interactive Provider services
Finally, I wanted to configure the RTC to support a couple of IProvider services – i.e., the RTC mounting an IProvider application running on my local (Windows) host PC. When the RTC receives any data requests for those services, it will forward those requests onto my IProvider – which can then choose to fulfil or reject the requests.
The first step was to define a route for my Interactive Provider service – so I updated the existing route list:
*rtc*routeList : cloud,iprov
And then declared the services for that route - note that I am also changing the port for this route to 14005
!!! IPROV on Windows Host Route
*rtc*iprov.route*serviceList : IPROV, DIRECT_FEED
*rtc*iprov.route*port : 14005
*rtc*iprov.route*hostList : host.docker.internal
*rtc*iprov.route*userName : umer.nalla
*rtc*iprov.route*protocol : rssl
*rtc*iprov.route*singleOpen : True
*rtc*iprov.route*allowSuspectData : True
*rtc*iprov.route*disableDataConversion : True
*rtc*iprov.route*compressionType : 1
*rtc*iprov.route*pingInterval : 2
*rtc*iprov.route*maxCache : 50000
*rtc*iprov.route*IPROV*appServiceName : IPROV
*rtc*iprov.route*DIRECT_FEED*appServiceName : DIRECT_FEED
You could just define a single service – however, I wanted some flexibility for testing purposes. Most of the EMA IProvider examples and the default EMA config file are hardcoded with the DIRECT_FEED service name. Defining an additional IPROV service just allows me to validate any config changes etc I make (to ensure I am not inadvertently relying on some defaults).
I defined the services as follows:
!!! Interactive Provider
*rtc*IPROV*cacheLocation : srcApp
*rtc*IPROV*cacheType : sinkDriven
*rtc*IPROV*maxCache : 50000
*rtc*IPROV*domainsCached : ALL
*rtc*IPROV*capabilityList : 6, 7, 8, 9, 10
*rtc*IPROV*buildCacheFromUpdates : False
*rtc*IPROV*markItemsOkOnUpdate : False
*rtc*IPROV*forwardPostUserInfo : False
*rtc*IPROV*dumpAccessLockFileName :
*rtc*IPROV*dumpAuditUserInfoFileName :
*rtc*IPROV*convertMfeedDataToRWF : False
*rtc*IPROV*validateMfeedToRWFConvForPosts : False
*rtc*IPROV*enableOverrideInsertRecordResp : False
*rtc*IPROV*overrideClearCache : False
!!! Interactive Provider
*rtc*DIRECT_FEED*cacheLocation : srcApp
*rtc*DIRECT_FEED*cacheType : sinkDriven
*rtc*DIRECT_FEED*maxCache : 50000
*rtc*DIRECT_FEED*domainsCached : ALL
*rtc*DIRECT_FEED*capabilityList : 6, 7, 8, 9, 10
As before, once the modified rtc.cnf file had been saved, I restarted the RTC container – either via the Docker Dashboard or from the command line e.g.
C:>docker restart rtc
Test the Interactive-Provider functionality
Once restarted, I can test my IProvider application. However, I need to ensure that the IProvider application will listen on port 14005 (for the inbound RTC connection) - rather than the default 14002 (I covered the reason for doing this in part 1).
For instance, as I was using the IProv100 example, I changed the OmmProvider port configuration as follow:
OmmProvider provider( OmmIProviderConfig().port( "14005" ), appClient );
Once I make the above change, rebuild and and fire up IProv100, I should see something like:
>IProv100.exe
loggerMsg
TimeStamp: 15:38:49.023
ClientName: ServerChannelHandler
Severity: Success
Text: Received ChannelUp event on client handle 2214874061056
Instance Name Provider_1_1
Connected component version: rtc3.5.3.L1.linux.rrg 64-bit
loggerMsgEnd
To test the IProvider I can then run a Consumer example connecting to the RTC and requesting data from the DIRECT_FEED service. Once again, I can re-use the Consumer example 100_MP_Streaming example – by just changing the service name as follows:
consumer.registerClient( ReqMsg().serviceName("DIRECT_FEED").name("TRI.N"), client );
NOTE: Just to be clear, the consumer will still be using port 14002 - connecting to the RTC, which will forward any item requests onto the IProvider on port 14005.
Provided the IProv100 is still running (pun intended!) the Consumer should get some data back e.g.:
RefreshMsg
streamId="5"
domain="MarketPrice Domain"
Solicited
RefreshComplete
state="Open / Ok / None / 'Refresh Completed'"
name="TRI.N"
serviceName="DIRECT_FEED"
Payload dataType="FieldList"
FieldList
FieldEntry fid="22" name="BID" dataType="Real" value="39.90"
FieldEntry fid="25" name="ASK" dataType="Real" value="39.94"
FieldEntry fid="30" name="BIDSIZE" dataType="Real" value="9"
FieldEntry fid="31" name="ASKSIZE" dataType="Real" value="19"
FieldListEnd
PayloadEnd
And so on….
When you move on from your development phase & your application is ready for UAT testing and connecting to your real RTDS system, remember to change the port back to the default 14002 (or whichever port your RTDS system uses).
Admin functions with rtcmon
The RTC package also includes an admin and monitoring tool called rtcmon (short for RTC Monitor)– which can be found in the /opt/distribution folder of the RTC container.
So, if I attach a shell to the RTC container with:
C:> docker exec -it rtc /bin/bash
And then run rtcmon:
# rtcmon
OR as pointed out by a reader (thank you!), you can use the one-line alternative:
C:> docker exec -it -w /opt/distribution/ rtc ./rtcmon
(where the -w param is setting the working directory to the location of rtcmon before executing it)
You should see something like:
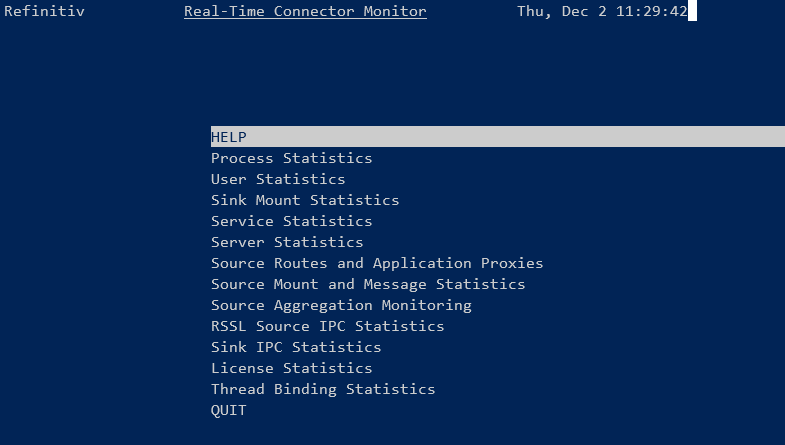
You can then experiment with the tool to see things like how many items each connected application has open or to drop services to observe the impact on your application etc.
Note: you will need to use Linux style navigation keys e.g. H, J, K, L for cursor movement, Tab for changing sections etc - as detailed in the RTC System Admin manual.
For example, to drop a service I perform the following:
· Select ‘Source Routes and Application Proxies’
· Tab to the ‘List of Source Routes’
· Select the route for the service you want to drop e.g. ‘cloud’
· Select the routeEnabled value (Enter to edit, Ctrl+U to delete existing value)
· Replace the True with False to drop the service
My application should then receive a Status Message indicating ‘Service down’ for any open instruments.
Once I have checked my application behaviour, I can set the above value back to True and the instrument should recover with a Refresh Message.
Configure a default service for WebSocket Requests
As mentioned earlier, the RTC can be configured such that when making Websocket API requests, you don’t need to explicitly specify a service name – RTC can default to a configured service.
This requires an additional change to the rtc.cnf file as follows:
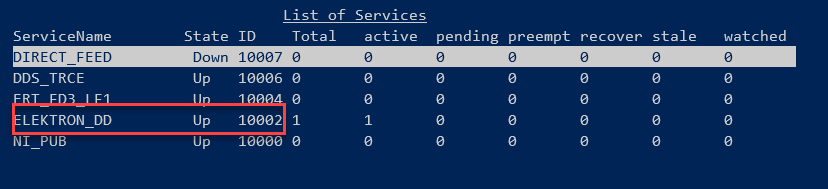
*rtc*defaultJsonServiceId : 10002
Where the 10002 represents the default service to use – however, this value may differ on your RTC installation.
To work out the correct Service Id, I fired up rtcmon and selected the ‘Service Statistics’ option and noted the ID for ELEKTRON_DD – which in my case was 10002:
Once I added the above ServiceId to my rtc.cnf, I restarted rtc as before
C:>docker restart rtc
I should then be able to make Websocket API requests from ELEKTRON_DD, without specifying the service name:
{
"ID": 2,
"Key": {
"Name": "TRI.N"
}
}
Other rtcmon + RTC functionality
There are probably other stats/figures and functions you can discover & experiment with in the relative safety of your own little ‘RTDS’ installation – by referring to the RTC System Admin manual linked below (your MDS admin team may also be able to advise you further) .
You can also experiment with/test other scenarios to observe their impacts on your application e.g.
- stop/restart RTC container
- kill RTC service from the docker bash shell
- restart docker
- deploy multiple RTC instances - to test scenarios like
- failover (with ChannelSets) when one RTC instance is stopped (and possibly restarted later)
- publishing to multiple servers
- source aggregation
Summary
As a developer having to code & test their Refinitiv Real-time Consumers, Providers and Posting (Contribution) applications there are certain test scenarios that often have a certain level of reliance on our local Market Data Admin teams. These teams are often quite stretched and may not able to be able to provide access to the RTDS testing resources in a timely manner - potentially causing a bottleneck in our testing regime.
Having access to our own Refinitiv Real-Time Connector can allow us to perform some of the tests at our pace and time of choosing - before we do our final testing in the 'real' RTDS environment. I hope the above guide will help you in the same way it has helped me in my RTDS testing regime without having to vie for my Market Data admin team's time.
Documentation/Articles referenced in the article:
- Part 1 of this article - basic Docker + RTC install & config
- Install Docker Desktop on Windows
- Start containers automatically | Docker Documentation
- Testing EMA Consumer and Provider Applications
- Docker Container Networking
- Configuring 'adspop' docker to connect to Refinitiv Real-Time Optimized
- VS Code Docker extensions - Visual Studio Marketplace
- Real-Time Connector System Admin manual
- A vanilla rtc.cnf - for you to modify as you work through the article
- My modified rtc.cnf (in case you don't!) - just fill in your credentials
Whilst I am running RTC inside a local Docker and the RT-SDK locally as well, a colleague of mine decided to deploy both RTC and RT-SDK inside Google Cloud Platform VM instances. You can read about this by clicking the article link in the top right hand of this article.
NOTE: As mentioned before, I am NOT an RTDS/RTC expert by a long shot - the above is based on my experimentation and pulling materials from various Refinitiv sources - feel free to contact me with corrections/improvements.
You can find additional links to related articles and the official Developer Portal pages for the RT-SDK etc in the right-hand panel at the top of this article.