

Earlier this year I had to plot some charts for a couple of articles I wrote on Technical Analysis and Volatility Surfaces + curves. Whilst researching which library or visualisation frameworks to use, I found several Python examples that consume some historical market price data and plot it - but barely any that presented real-time streaming tick data.
So I made a mental note to explore this a bit further...
Fast forward a few months and I am going to present 3 simple uses of streaming data with Python-based interactive charting and/or visualisation libraries - namely Dash Plotly, Matplotlib and ipywidgets - using the Refinitiv Data Platform Library to consume the Streaming Data.
In the spirit of full disclosure, I should point out that I have previously presented this material as part of a Webinar back in July 2020.
Dash from Plotly
Initially I will look at Dash from Plotly - which seems to be one of the most popular frameworks out there for Data science web apps.
I was a complete Dash newbie and this was the first item I had tried to use the framework - yet I found it relatively easy to use. I have tried to keep the example fairly simple - whilst at the same time trying to convey a flavour of what is possible in terms of using streaming data with Dash.
I will start with a look at the output of my Dash example, before moving onto an exploration of the actual code.
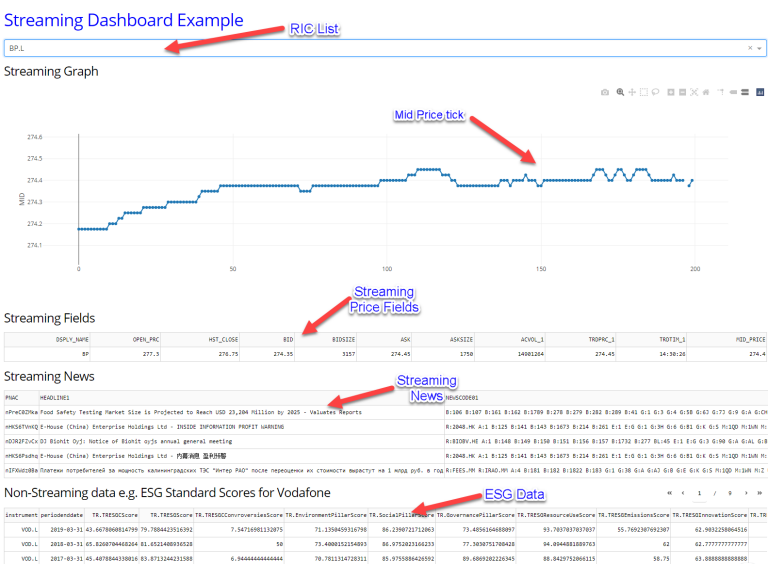
Starting at the top:
- I have a drop-down list with a few instrument symbols (RIC codes).
- Then I have a chart where I am pulling 200 historical ticks for MID Price and then updating with the latest Mid Price, every second, for the selected RIC - in this case 'BP.L'.
- Below that you can see a selection of streaming price fields which are also being updated on a regular interval.
- Underneath the streaming fields we have some Streaming News with the headlines and the news story codes etc.
I know this article has Streaming Data in the title, however, I just wanted to include some non-streaming stuff - just to highlight that you can access both streaming and non-streaming data using the RDP library - so in the final panel I am pulling in some Environmental, Social and Governance data for Vodafone.
Code Overview
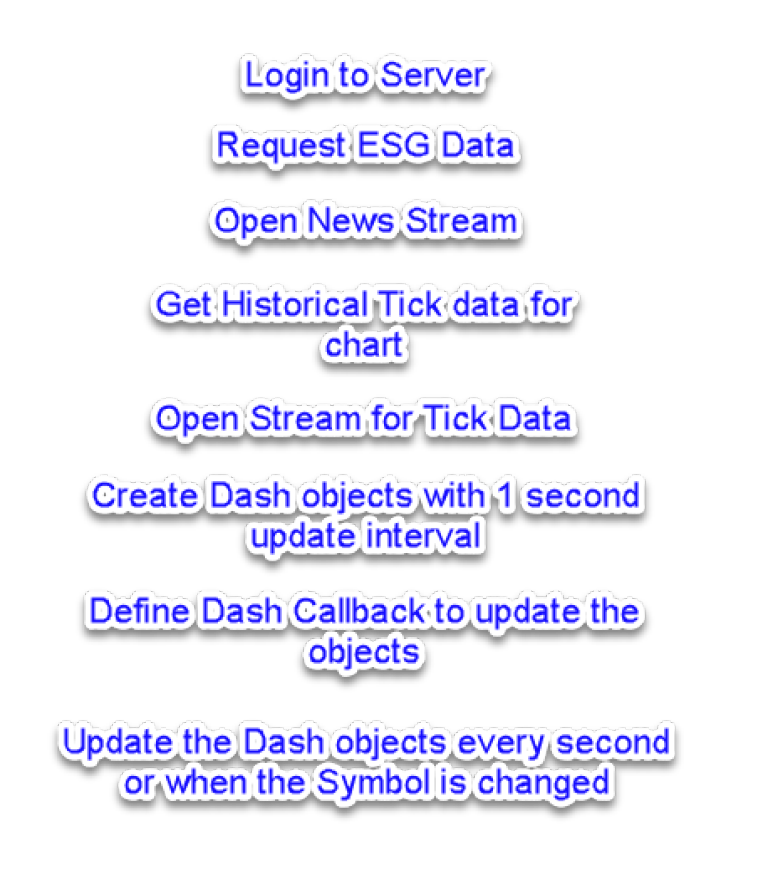
Before moving onto the detailed code walkthrough, I just want to present a high level overview of the key code constructs:
Code Walkthrough
At the start of the file I declare a few global variables as follows:
- esg_df - dataframe to hold my ESG data
- tick_list - list of mid price ticks used to plot the streaming chart
- streaming_news - RDP.StreamingPrices object for consuming Streaming News
- streaming_price - RDP.StreamingPrices object for consuming Streaming Price data
- news_history - dataframe to store news stories as received - so we can show the 5 most recent ones
- ric_list - symbols (RIC codes) use to populate the drop-down list
- stream_fields - selection of fields to request for the Streaming Price data
- news_ric - symbol for Streaming News
Data request function
Next I have the main function for requesting my streaming and non-streaming data.
def get_data(ric, initial_run=False):
global esg_df, tick_list, streaming_price, streaming_news, news_history
if initial_run:
# ESG DATA
esg_df = rdp.get_esg_standard_scores(universe='VOD.L')
# Streaming News
streaming_news = rdp.StreamingPrices(universe=[news_ric], fields=news_fields)
streaming_news.open()
news_history = streaming_news.get_snapshot()
# Price History
tick_hist_df = rdp.get_historical_price_events(ric, fields=[tick_field], count=200)
tick_list = pd.to_numeric(tick_hist_df[tick_field]).to_list()
tick_list.reverse()
# Streaming Price
streaming_price = rdp.StreamingPrices(universe=[ric], fields=stream_fields)
streaming_price.open()
On the initial run, get_data requests the ESG data for Vodafone and also opens the stream for the News.
For the initial run and whenever a different symbol is selected in the drop-down list, the function will also do the following for the selected symbol
- request the historical tick data I will use to back-fill the chart.
- open the stream for the live tick data.
I will call the above function as part of the initialisation and it will also be invoked when the user changes the symbol in the drop-down list (see later).
Initialisation
As part of the initialisation, I read my login credentials and use them to establish a session (connection) to the server, after which I call the above get_data function with the initial_run flag set to True in order to get the ESG data and establish the News and Price streams:
config = cp.ConfigParser()
config.read("c:/Refinitiv/config.cfg")
rdp.open_platform_session(
config['session']['app_key'],
rdp.GrantPassword( username=config['session']['user'],
password=config['session']['password']))
time.sleep(1)
get_data(ric_list[0], True)
I then define my Dash Framework objects - the details of which you can explore in more detail over on the Plotly website. However, the key things to note here are
- id of each object which I will refer to when we look at the callback method in a moment
- animate=true for the Graph
- interval = 1000
- I am populating the ESG data as part of the object creation - since I have already fetched the ESG data and it's not going to change
app = dash.Dash("RDP Dashboard",prevent_initial_callbacks=True)
app.layout = html.Div([
html.H2('Streaming Dashboard Example', style={'color': 'blue'}),
html.Div(id='nop1'),
dcc.Dropdown(id='ric-dropdown',
options=[{'label': i, 'value': i} for i in ric_list],
value=ric_list[0]),
html.Div(id='nop2'),
html.H4('Streaming Graph'),
dcc.Graph(id='live-graph', animate=True),
dcc.Interval(id='stream-update', interval=1 * 1000),
html.H4('Streaming Fields'),
dte.DataTable(id='tickData',
columns=[{'name': i, 'id': i} for i in stream_fields]),
html.H4('Streaming News'),
dte.DataTable(id='newsData',
columns=[{'name': i, 'id': i} for i in news_fields],
style_cell={'textAlign': 'left'},
page_size=5),
html.H4('Non-Streaming data e.g. ESG Standard Scores for Vodafone'),
dte.DataTable(id='esgData',
columns=[{"name": a, "id": a} for a in esg_df],
data=esg_df.to_dict('records'),
style_table={'overflowX': 'auto'}
),
])
The id of each object is used for the handling the input and output for the object using a callback method - which takes one or more ids tagged as Output or Input:
@app.callback([Output('live-graph', 'figure'),
Output('tickData', 'data'),
Output('newsData', 'data') ],
[Input('ric-dropdown', 'value'),
Input('stream-update', 'n_intervals')])
Here I am tagging the graph, the streaming price fields table and the news table as outputs, with the drop-down symbol list and the interval timer as input triggers for the callback.
In other words, every 1 second OR when the symbol in the drop-down list is changed, the following callback handler will be triggered. The callback handler will then be expected to respond with the data required to update the Output type objects i.e. graph data, streaming price data and the news data.
def update_ric(selected_ric, input_data):
global prev_ric, news_history, tick_list
if selected_ric == prev_ric:
tick_list.pop(0)
tick_list.append(streaming_price.get_snapshot()[tick_field].iloc[0])
else:
print("RIC change from {} to {}".format(prev_ric, selected_ric))
prev_ric = selected_ric
get_data(selected_ric)
streaming_fields = streaming_price.get_snapshot()
latest_news = streaming_news.get_snapshot()
if not latest_news['PNAC'].iloc[0] == news_history['PNAC'].iloc[0]:
news_history = latest_news.append(news_history)
data = plotly.graph_objs.Scatter(
y=tick_list,
name='Scatter',
mode='lines+markers'
)
return {'data': [data], 'layout': go.Layout(yaxis={'title': 'MID',
'range': [min(tick_list) * 0.9994, max(tick_list) * 1.0006]})}, \
streaming_fields.to_dict('records'), news_history.to_dict('records')
The Dash framework does provide a 'callback context' to indicate what triggered the callback method - the interval or the drop-down - but when I was testing I kept receiving phantom callbacks for the drop-down, even when I had not change the symbol.
Therefore, to keep things simple I just check to see if the selected_ric has changed from the previously selected symbol.
If the symbol has not changed, I remove the oldest historical tick price and append the latest price to the list.
If the symbol has changed, I store the newly selected symbol name and use my get_data method to fetch the historical tick data and Price stream for the newly selected symbol.
I then fetch gets the latest streaming price plus any latest news data and use them to update and return data for the graph, the stream price table and news table - i.e. the Outputs as defined in the callback segment above.
Note that I convert the data to the Dash required format of a python Dictionary before returning it.
All that remains is to start the Dash server:
if __name__ == '__main__':
app.run_server(debug=True)
which takes a few seconds to startup - after which you can navigate to Dash in your browser and see the example in action.
Dash Summary
When I was first exposed to the Dash Framework I was seriously impressed by how little code was required to produce the data charts + tables. To further illustrate this point - whilst I was writing this article, my teenage son (who is learning Python at school) reacted with 'Woah! Just that much code produces those charts and tables! Seriously?'
Just to recap the key learning:
- Dash allows you to easily render & update charts, tables etc on an interval and/or interactive basis
- You can use the RDP Python library to consume the required data and pass it off to the Dash framework and it let it get on with the otherwise tricky task of visualising the data in the required format
Matplotlib
Whilst Dash is pretty cool for creating a Dashboard with multiple visualisation elements etc, it requires the resultant app to run in a browser (along with the Dash server instance). If, however, you just want to plot a simple Streaming data chart as part of a more conventional Python script or perhaps inside a Jupyter Notebook, we can do that using the better known Matplotlib library.
For my next example, I will create a simple chart which plots streaming BID and ASK ticks for a single instrument. The code for fetching the tick data will be very similar to the Dash example above.
Get my tick data
As per before I will fetch some historical ticks to back-fill the chart and then open a stream for the live tick data:
global bid_list, ask_list
ric = 'EUR='
# Back fill tick history
ticks = 100
df = rdp.get_historical_price_events(ric, fields=['BID', 'ASK'], count=ticks)
bid_list = pd.to_numeric(df['BID']).to_list()
ask_list = pd.to_numeric(df['ASK']).to_list()
bid_list.reverse()
ask_list.reverse()
# Live prices
streaming_prices = rdp.StreamingPrices(
universe=[ric],
fields=['BID', 'ASK']
)
streaming_prices.open()
def animate(i):
bid = streaming_prices[ric]['BID']
ask = streaming_prices[ric]['ASK']
re_plot = False
if bid != bid_list[ticks - 1] or ask != ask_list[ticks - 1]:
bid_list.pop(0)
bid_list.append(bid)
ask_list.pop(0)
ask_list.append(ask)
re_plot = True
if re_plot:
lower_y = min(bid_list) * 0.9995
upper_y = max(ask_list) * 1.0005
plt.cla()
plt.ylim(lower_y, upper_y)
plt.plot(bid_list, label='Bid', )
plt.plot(ask_list, label='Ask')
plt.legend(loc='upper left')
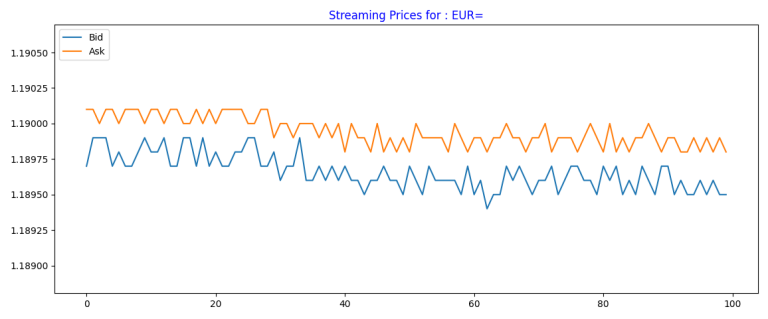
plt.title(f"Streaming Prices for : {ric}",color='b')
plt.tight_layout()
Here, I first snap the latest BID+ASK values from the streaming price object and then check to see if either value has changed since the previous corresponding tick. If either value has changed I append the latest tick values to the two lists and remove the oldest values.
I then use these updated lists to re-plot the chart showing the latest ticks.
Clearly, I do not need to check if the values had changed - I just felt this made the chart look more volatile - i.e. eliminate the flat lines when the value does not change for periods of time.
All that remains is to initialise initiate the animate functionality and display the chart:
fig = plt.gcf()
fig.canvas.set_window_title('Streaming with Matplotlib')
ani = FuncAnimation(fig, animate, interval=300)
plt.tight_layout()
plt.show()
Which will look something like this:
Event driven or interval based updates?
You will have noticed that for the above two examples, the updating of the chart is on an timed interval basis i.e. 1s for the Dash example and 300ms for the Matplotlib one. However, in reality Streaming data is usually delivered on an a 'as and when' event basis - e.g. whenever there is a change in the Quote price or when a Trade takes place.
Looking around for event driven data visualisation libraries, I found that Ipywidgets offers this facility and it appears that Holoviews and Bokeh may also offer event driven updates (though I have not checked these out yet).
Ipywidgets
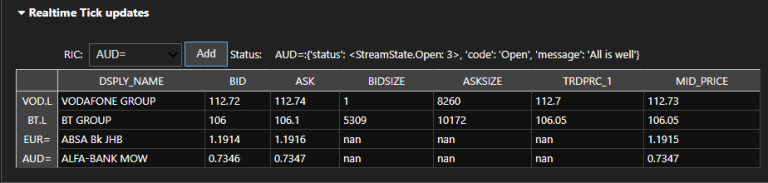
So, for my final example, I will implement a simple ticker sheet using Ipywidgets + Ipysheet - allowing the user to select a RIC and add it to a table - showing a few fields updating on an event driven basis.
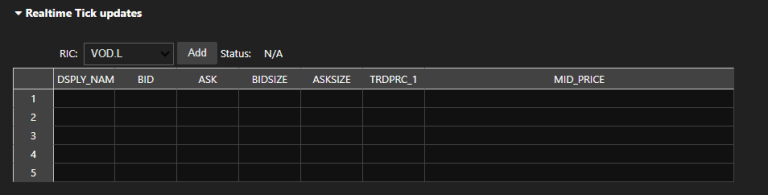
my_fields = ['DSPLY_NAME','BID','ASK','BIDSIZE','ASKSIZE','TRDPRC_1','MID_PRICE']
drop_rics = ['VOD.L','BT.L','JPY=','EUR=','AUD=']
ticks_table = ipysheet.sheet(rows=len(drop_rics),columns=len(my_fields),
column_width=[10,10,10,10,10,10],
column_headers=my_fields,row_headers=True)
ric_drop_down = widgets.Dropdown(description='RIC:', options=drop_rics,
value='VOD.L', continuous_update=False, layout={'width':'200px'})
btn_add = widgets.Button(description='Add',layout={'width':'50px'})
btn_add.on_click(add_ric)
lbl_status = widgets.Label(' Status:', layout={'width':'50px'})
status_output = widgets.Label("N/A")
As well as my table and drop-down, I create a:
- a button for adding the selected drop-down instrument to the table
- a label to show any status message received from the server e.g. All is Well, Suspect Data etc.
Initialise my event streams
You will note in the above code, that the add button will call the add_ric function when clicked. This is where I open my event stream for the selected instruments:
def add_ric(value):
global status_output,streaming_prices,rics
ric = ric_drop_down.value
if ric not in rics:
rics.append(ric)
streaming_prices = rdp.StreamingPrices(
universe = rics,
fields = my_fields,
on_complete = lambda streaming_prices :
create_tick_table(streaming_prices),
on_update = lambda streaming_prices, instrument_name, updated_fields :
update_tick_table(instrument_name, updated_fields),
on_status = lambda streaming_price, instrument_name, status :
display_status(instrument_name, status)
)
streaming_prices.open()
return
I add the selected instrument to the list of instruments and then open a Stream for all the items in the list. Ideally I would only open a new stream for each item as it is added. However, my current approach allows me to keep this example code relatively simple.
I also specify a number functions to handle the various event types generated by the StreamingPrices object:
- on_complete - once I receive the initial Image response for all the instruments in my request, the create_tick_table function will be executed
- on_update - as and when any single instrument receives one or more field updates, it calls update_tick_table
- on_status - for any status message from the server, I will display it in the previously defined status label.
Note that for the on_update handler I pass in the updated_fields and for the on_status handler I pass in the status variable.
Create my tick table
As noted above, when I make the request to open the stream for my instruments, (assuming the instruments are valid), the library will execute the create_tick_table method once it has received the initial Image data from the server for all the instruments in my request.
def create_tick_table(streaming_prices):
global df,ticks_table
snapshot = streaming_prices.get_snapshot()
field_names = snapshot.columns[1:]
rics = snapshot['Instrument'].values
df = pd.DataFrame(index=rics, columns=field_names)
for ric in streaming_prices:
for field_name, field_value in ric.get_fields().items():
df.at[ric.name, field_name] = field_value
ticks_table = ipysheet.from_dataframe(df)
table_widget.children = [table_header, ticks_table]
To populate my tick table:
- snapshot the current values for all my instruments,
- extract the field names for my table column headings,
- extract my instrument codes,
- use the above to initialise a dataframe ,
- populate the dataframe with the field values,
- and finally convert the dataframe into a ipysheet object for my streaming ticks table
As I mentioned earlier, in order to keep things simple, I am cheating and re-requesting the newly expanded list of instruments each time the user adds a new one. In reality I could keep a cache of StreamingPrices - with each one representing a single instrument - but I felt the added complexity of this approach would have detracted from the main purpose of this example.
Note: I have been told that a future version of StreamingPrices may allow the ability to add a new instrument to an active StreamingPrices instance.
Update the tick table
Once the initial Image response has been received, the library will continue to receive updates as and when one or more field values change. Each time one of these updates is received from the server, the specified on_update handler function will be called:
def update_tick_table(ric, fields):
global df,ticks_table
for field_name, field_value in fields.items():
df.at[ric, field_name] = field_value
ticks_table = ipysheet.from_dataframe(df)
table_widget.children = [table_header, ticks_table]
Here I have been provided with RIC code for the updated instrument, updated field names and their values - which I extract and use to update my streaming ticks table.
Status Information.
When a streaming request is sent to the server, the server can respond with a Status Message e.g.
- if the user is not entitled to the data,
- an invalid instrument is requested
- the service is not available
For a valid instrument, once a event stream is active, you can receive further status messages such as:
- All is Well - data and and stream state is good
- Suspect Data - stream is active, but there is some concern about the quality of data
Therefore, when developing a streaming data example, it is important to handle these status messages appropriately e.g. logging problems to a log file and/or making the user aware of any problem. In my example, I am simply displaying the most recent status message along the top of the tick table as shown in the finished product below:
Closing comments
I hope I have successfully demonstrated, that it is relatively straightforward to visualise streaming data using Python and the various libraries available.
In my first two examples, I plotted a chart with streaming tick data by 'animating' the chart using historical ticks to back-fill and then by appending the latest tick values on a timed interval basis. For the ipywidgets example I updated a table with streaming data values on an event driven basis - i.e. as and when any of the field values changed.
My aim behind writing this article, was to provide a basic flavour of just what is possible in terms of Dashboards and visualisation of Streaming data in Python and I hope that I have succeeded in doing so.
Related APIs