
Author:


The Refinitiv Real-Time SDKs (RTSDKs) provide consumer, provider, and contributor features available to developers of applications to connect to Refinitiv Real-Time Solutions through low-level (transport) and high-level (message) interfaces. It is a suite of modern and open-source APIs that are designed to simplify development through a strong focus on ease of use and standardized access to a broad set of Refinitiv and proprietary content and services.
It currently supports C/C++, Java, and C# programming languages and can be run on several operating systems including Windows, Oracle Linux, Red Hat Enterprise Linux, and CentOS. The Real-Time SDK (RTSDK) consists of the Enterprise Transport and Message APIs packaged together.
- The Enterprise Transport API (ETA) is the high-performance, low-latency, foundation of the Refinitiv Real-Time Software Development Kit. This API allows applications to achieve the highest throughput, lowest latency, low memory utilization, and low CPU utilization when publishing or consuming content.
- The Enterprise Message API (EMA) is the data-neutral, multi-threaded, ease-of-use API providing access to Open Message Model (OMM) and Refinitiv Wire Format (RWF) data. As part of the Refinitiv Real-Time Software Development Kit, or RTSDK. This API allows applications to consume and provide OMM data at the message level of the API stack.
This article summarizes the Refinitiv Real-Time SDK performance test results of consumer, interactive provider, and non-interactive provider applications by focusing on throughput, steady state latency, and average CPU usages over different network protocols such as TCP Socket encrypted and non-encrypted.
To share your thoughts, comments, or suggestions, please use this channel.
It covers the following topics:
- Testing Environment
- RTSDK Performance Test Tools
- Consumer Performance Test Results
- Interactive Provider Performance Test Results
- Non-Interactive Provider Performance Test Results
- Summary
- References
For the full description, please refer to the Refinitiv Real-Time SDK Performance Report.
Machine Specifications
The Refinitiv Real-Time SDK applications and Refinitiv Real-Time Distribution System (RTDS) components are running on the HPE ProLiant DL360 Generation 10 (Gen10) servers with the following specifications.
| Component | Description |
|---|---|
| Processor | Intel(R) Xeon(R) Gold 6242 CPU @ 2.80GHz (16-core) |
| Memory | 64GB RAM (4 x 16GB, 32 GB per processor), Rank: 2, DDR4-2933MHz |
| Network Adapter | Solarflare SFN8522-R3 8000 Series 10G Adapter |
The first server runs the Refinitiv Real-Time SDK performance tools. The second and the third servers run Refinitiv Real-Time Advanced Distribution Hub (ADH) and Refinitiv Real-Time Advanced Distribution Server (ADS), respectively. All three servers have the same specifications.
Software Versions
The following versions of the software are used in the test environment.
| Software | Version |
|---|---|
| Refinitiv Real-Time SDK C/C++ | 2.0.7.L2 (ETA/EMA 3.6.7.2) |
| Refinitiv Real-Time SDK Java | 2.0.8.L1 (ETA/EMA 3.6.8.0) |
| Refinitiv Real-Time Advanced Distribution Hub | 3.6.2.L1 |
| Refinitiv Real-Time Advanced Distribution Server | 3.6.2.L1 |
| Operating System | Red Hat Enterprise Linux 8 Update 4 (64-bit) |
| GCC Compiler | 8.5.0 20210514 |
| Oracle JDK | 1.8.0_211 |
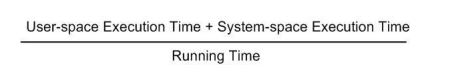
- For RTSDK Java, the getProcessCpuLoad() method of OperatingSystemMXBean with the calculation getProcessCpuLoad() * 100 * N is used to determine CPU usage. N is the number of cores and is retrieved from the getAvailableProcessors() method of OperatingSystemMXBean.
Test Settings
The message size on these tests was locked at 130 Bytes. All performance tests were executed with a watchlist size of 100,000 items except for Websocket JSON Java tests that used a watchlist size of 20,000. Available data formats include:
- JSON: Text-based data format following the JavaScript Object Notation.
- RWF: Refinitiv Wire Format, a Refinitiv proprietary binary format for data representation.
The test results use specific sets of parameters for a range of update rates, such as tcpNoDelay, maxPackCount, packBufSize, highWaterMark, and directWrite. The sets of parameters are categorized into categories (A, B, C, ...). For example, the following table represents the test configurations for the ETA C interactive provider.
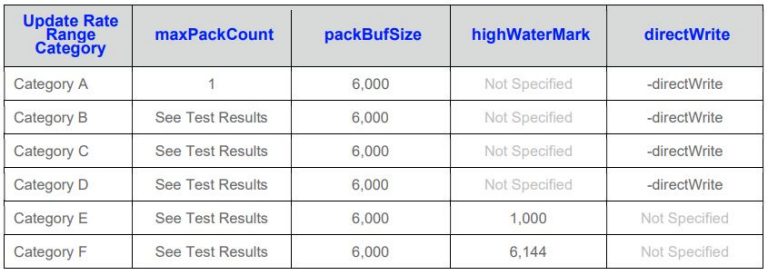
For the full specifications and configurations, please refer to the Refinitiv Real-Time SDK Performance Report.
RTSDK Performance Test Tools
The tools used to generate this report are the Refinitiv Real-Time Open Source Performance Tools available in the Refinitiv Real-Time SDK packages. The general idea behind the Open Source Performance Tool Suite is to provide a consistent set of platform test applications that look and behave consistently across the Refinitiv Real-Time APIs. They are provided as buildable open-source and demonstrate best practices and coding for performance with their respective APIs.
The following tools are used to generate the results in this report.
Consumer Performance Tools
The consumer performance tools implement OMM consumers using the Refinitiv Real-Time SDKs (C/C++ and Java). They connect to providers (such as Interactive Provider Performance Tools or Refinitiv Real-Time Distribution System), request items, process the refresh and update messages they receive, and calculate statistics such as CPU usage, update rate, and latency.
In this test environment, the consumer performance tools connect to the Refinitiv Real-Time Distribution Server (ADS) running on another machine and consume real-time data published by the Interactive Provider Performance Tools, as shown in the following diagram.
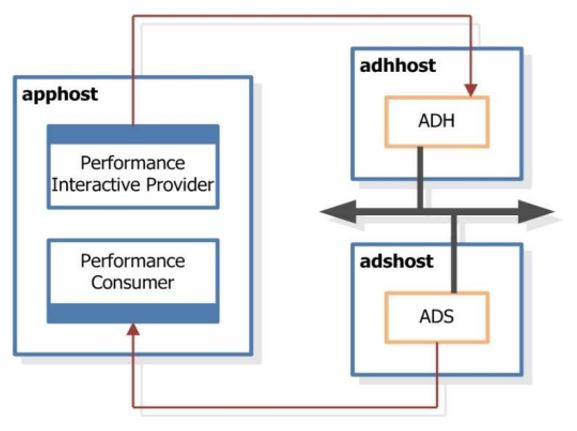
The performance tools are running on the same machine while ADH and ADS are running on different machines.
Interactive Provider Performance Tools
The Interactive Provider Performance Tools implement OMM interactive providers using the Refinitiv Real-Time SDKs (C/C++ and Java). They start a server that allows OMM consumers to connect (either directly or through Refinitiv Real-Time Distribution System), provide customizable refresh messages and update messages for requested items, and display statistic information, such as CPU usage, memory usage, and update rate.
In this test environment, the interactive provider performance tools connect to the Refinitiv Real-Time Distribution Hub (ADH) running on another machine and publish real-time data requested by the consumer performance tools, as shown in the following diagram.
The performance tools are running on the same machine while ADH and ADS are running on different machines.
Non-Interactive Provider Performance Tools
The Non-Interactive Provider Performance Tools implement Open Message Model non-interactive providers using the Refinitiv Real-Time SDKs (C/C++ and Java) for use with the
Refinitiv Real-Time Advanced Distribution Hub on the Refinitiv Real-Time Distribution System. They connect to the Refinitiv Real-Time Advanced Distribution Hub, publish real-time services, provide images and updates, and display statistical information, such as CPU usage, memory usage, and update rate.
In this test environment, the non-interactive provider performance tools connect to the Refinitiv Real-Time Distribution Hub (ADH) running on another machine and publish real-time data. Then, the consumer performance tools consume real-time data published by the non-interactive provider performance tools, as shown in the following diagram.
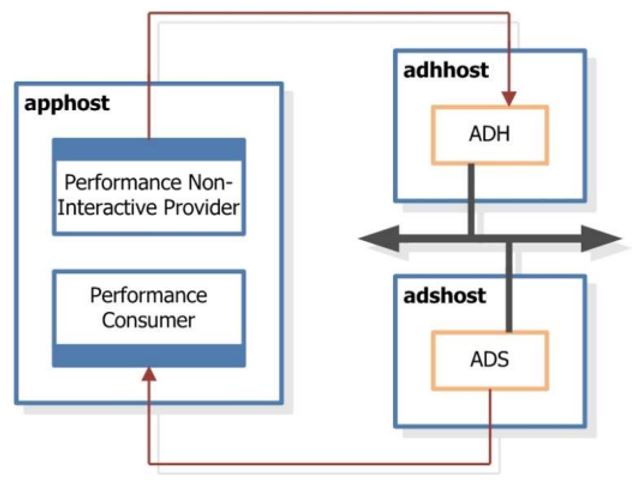
The performance tools are running on the same machine while ADH and ADS are running on different machines.
Consumer Performance Test Results
All consumer performance tests were conducted using a specific transport, specific network protocol, and data format. Consumer applications can leverage HTTPS to establish an encrypted tunnel connection, performing key and certificate exchange. Performance metrics are provided for both non-encrypted and encrypted connections were available. The results in this article reflect the specific hardware, compiler, API release, ADS/ADH release, and configuration as defined previously in the article. Any deviation from the above environments can affect performance results.
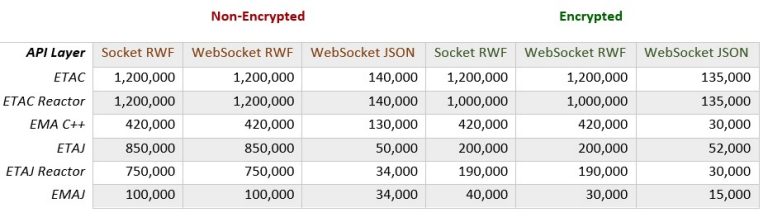
Throughput Ceiling
The following table and graph show the maximum sustained throughput metrics in updates per second (udps) for the following models:
· ETA C and Java.
· ETA C and Java with Reactor allowing for heartbeat management, connection and item recovery.
· EMA C++ and Java
Performance metrics are provided for both non-encrypted and encrypted connections, JSON, and RWF over socket and Websocket. The higher number of updates per second indicates better performance.
The following graph is a visual representation of the above results.
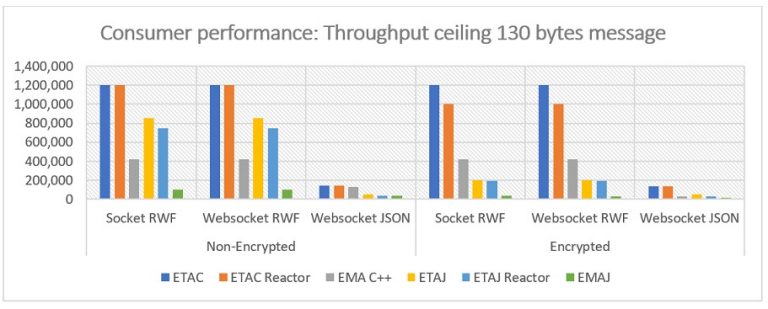
As we can see from the above table and graph for the Consumer throughput ceiling performance tests, the ETA C and ETA C Reactor show a consistent high performance both in the encrypted and non-encrypted space. ETAC maintains throughput at 1,200,000 messages socket and Websocket RWF in both spaces while ETA C Reactor performance is somewhat decreased at 1,000,000 for the encrypted Websocket RWF scenario. ETAJ and ETAJ Reactor closely follow with similar performance results at 850,000 and 750,000 throughputs followed by EMA C++ and EMAJ at 420,000 and 100,000 message throughputs. As expected, JSON formats introduce some overheads in the process that affect performance.
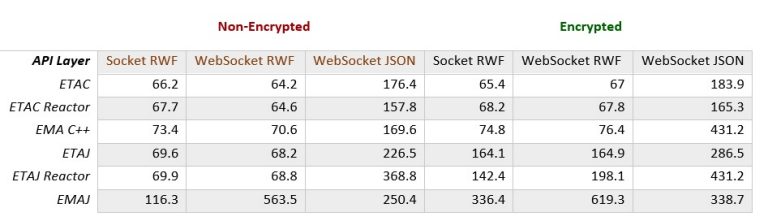
Steady State Latency
The following table and graph show maximum Steady State Latency (μsecs) metrics at 10,000 updates per second (udps) for the following models:
- ETA C and Java.
- ETA C and Java with Reactor allowing for heartbeat management, connection, and item recovery.
- EMA C++ and Java
Performance metrics are provided for both non-encrypted and encrypted connections, JSON, and RWF over the socket and Websocket API layers. Lower latency results in better performance.
The following graph is a visual representation of the above results.
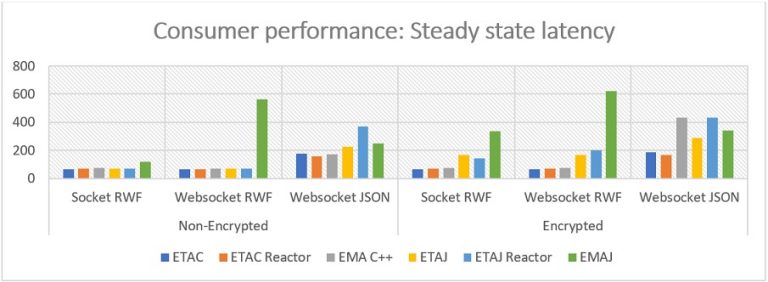
As we can see from the above table and graph for the Consumer steady state latency performance tests, the ETA C and ETA C Reactor show a consistent low latency both in the encrypted and non-encrypted space at an average of 66.38 μsecs. As expected, the use of encryption does introduce some overhead in the process. ETA Java and ETA Java Reactor very closely follow with an average latency around 69 μsecs for the non-encrypted scenarios and 167 μsecs for the encrypted ones. For the Websocket JSON scenarios, we see that JSON format overheads affect performance. EMA C++ and EMA Java show slightly higher latencies with EMA C++ stabilizing at around 74 μsecs for non-JSON scenarios and EMAJ showing some variance across scenarios with performance ranging from 116.3 μsecs to 619.3 μsecs.
RTSDK C/C++: Average CPU Usage
The following line chart compares the average CPU usage of the Refinitiv Real-Time SDK C/C++ consumer performance tools (EMA C++, ETA C Reactor, ETA C) versus various update rates for the Socket RWF and Encrypted Socket RWF connection types. When the update rate is constant, lower CPU usage indicates better performance.
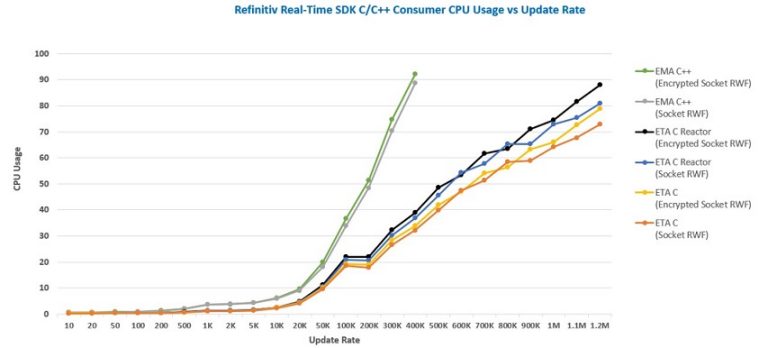
The following points derive from the chart.
- With the same API and update rate, the average CPU usage of the encrypted socket RWF connection is slightly higher than the average CPU usage of the socket RWF connection
- With the same update rate, the average CPU usage of EMA C++ is the highest while the average CPU usage of ETA C is the lowest
- At 400K update rate, the average CPU usage of EMA C++ is around 90 percent while the average CPU usage of ETA C is around 30-40 percent
- At 1.2M update rate, the average CPU usage of ETA C Reactor is around 80-90 percent while the average CPU usage of ETA C is around 70-80 percent
RTSDK Java: Average CPU Usage
The following line chart compares the average CPU usage of the Refinitiv Real-Time SDK Java consumer performance tools (EMA Java, ETA Java Reactor, ETA Java) versus various update rates for the Socket RWF and Encrypted Socket RWF connection types. When the update rate is constant, lower CPU usage indicates better performance. When the update rate is constant, lower CPU usage indicates better performance.
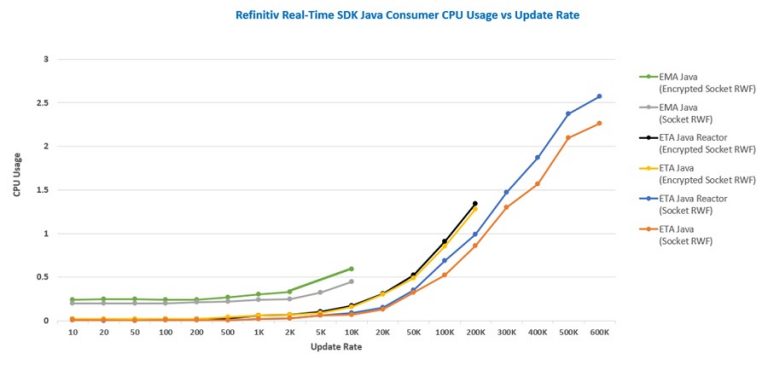
The following points could be summarized from the chart.
- With the same API and update rate, the average CPU usage of the encrypted socket RWF connection is higher than the average CPU usage of the socket RWF connection
- With the same update rate, the average CPU usage of EMA Java is the highest while the average CPU usage of ETA Java is the lowest
- With the same update rate and the encrypted socket RWF connection type, the average CPU usage of the ETA Java Reactor is slightly higher than the average CPU usage of the ETA Java
Interactive Provider Performance Test Results
All interactive provider performance tests were conducted using a specific transport, specific network protocol, and data format. The results in this article reflect the specific hardware, compiler, API release, ADS/ADH release, and configuration as defined previously in the article. Any deviation from the above environments can affect performance results.
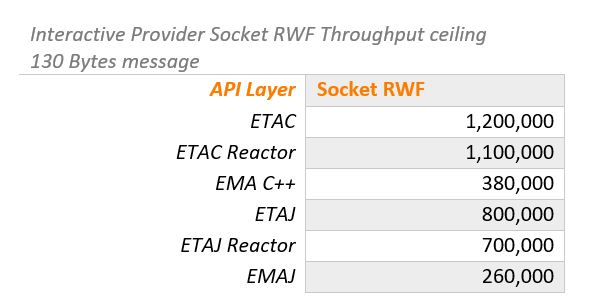
Throughput Ceiling
The following table and graph show the maximum sustained throughput metrics in updates per second (udps) for the following models:
- ETA C and Java.
- ETA C and Java with Reactor allowing for heartbeat management, connection, and item recovery.
- EMA C++ and Java
The higher number of updates per second indicates better performance.
Performance metrics are provided for Socket RWF:
The following graph is a visual representation of the above results.
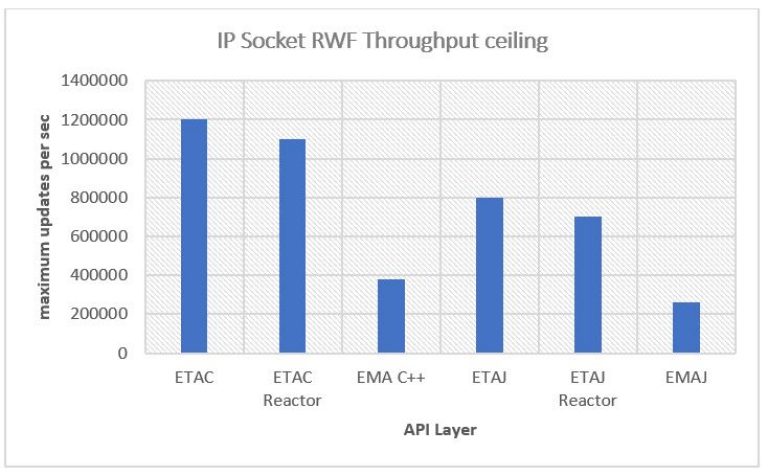
As we can see from the above table and graph for the Interactive Provider throughput ceiling performance tests, the ETA C and ETA C Reactor show consistent high performance at 1,200,000 and 1,100,000 message throughputs. ETA Java and ETA Java Reactor closely follow with significant performance results at 800,000 and 700,000 throughput ceilings followed by EMA C++ and EMA Java at 380,000 and 20,000 message throughputs.
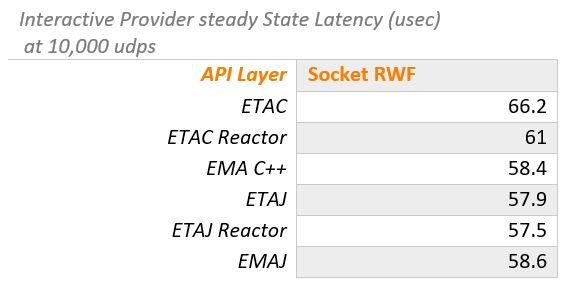
Steady State Latency
The following table and graph show maximum Steady State Latency (usec) metrics at 10,000 updates per second (udps) for the following models:
- ETA C and Java.
- ETA C and Java with Reactor allowing for heartbeat management, connection, and item recovery.
- EMA C++ and Java
Values in each cell represent the achieved steady state latency by the component under test (Interactive Providers) in microseconds (usec). Lower latency results in better performance.
Performance metrics are provided for Socket RWF:
The following graph is a visual representation of the above results.
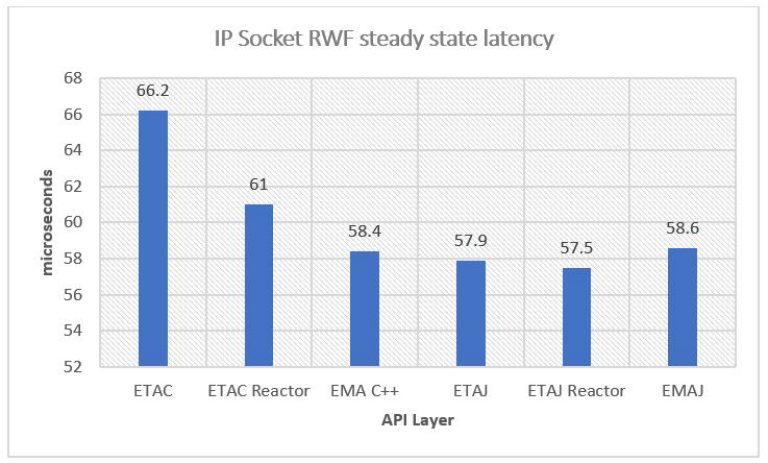
As we can see from the above table and graph for the Interactive Provider steady state latency performance tests, the ETA C and ETA C Reactor show consistent low latencies at 66.2 and 61msecs. ETA Java and ETA Java Reactor very closely follow with latencies at 57.9 μsecs and 57.5 μsecs, followed by EMA C++ and EMAJ with slightly higher latencies.
RTSDK C/C++: Average CPU Usage
The following line chart compares the average CPU usage of the Refinitiv Real-Time SDK C/C++ interactive provider performance tools (EMA C++, ETA C Reactor, ETA C) versus various update rates for the Socket RWF connection type. When the update rate is constant, lower CPU usage indicates better performance.
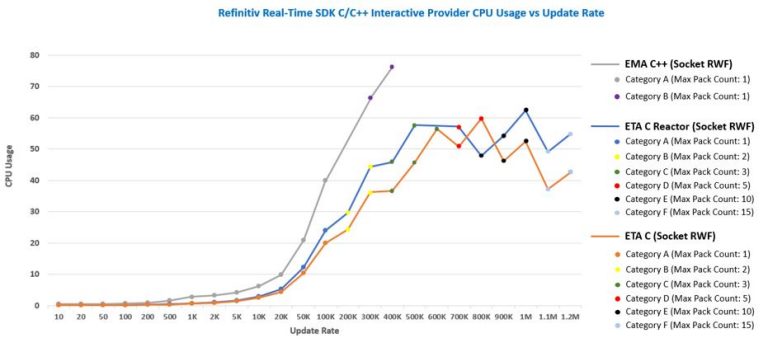
The following points could be extracted from the chart.
- With the same update rate, typically the average CPU usage of EMA C++ is the highest while the average CPU usage of ETA C is the lowest
- At 400K update rate, the average CPU usage of EMA C++ is around 70 percent while the average CPU usage of ETA C is around 30-40 percent
- Changing the category can impact the average CPU usage and update rates. For example, changing from category D to category E at 800K update rate in ETA C can lower the average CPU usage while the update rate is increasing to 900K
For each category setting, please refer to the Refinitiv Real-Time SDK Performance Report.
RTSDK Java: Average CPU Usage
The following line chart compares the average CPU usage of the Refinitiv Real-Time SDK Java interactive provider performance tools (EMA Java, ETA Java Reactor, ETA Java) versus various update rates for the Socket RWF connection type. When the update rate is constant, lower CPU usage indicates better performance.
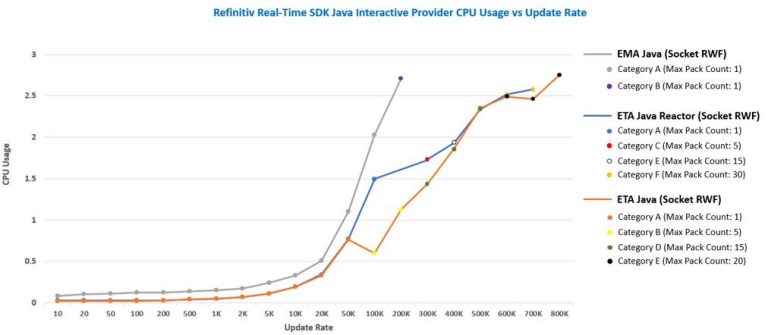
The following points could be extracted from the chart.
- With the same update rate, typically the average CPU usage of EMA Java is the highest while the average CPU usage of ETA Java is the lowest
- Changing the category can impact the average CPU usage and update rates. For example, changing from category A to category B at 50K update rate in ETA Java can lower the average CPU usage while the update rate is increasing to 100K
- The average update rate of ETA Java and ETA Java Reactor is not much different when the update rate is 50K and below
- Around the average CPU usage of 2.71, EMA Java can publish about 200K updates per second while ETA Java can publish about 700K updates per second
For each category setting, please refer to the Refinitiv Real-Time SDK Performance Report.
Non-Interactive Provider Performance Test Results
All non-interactive provider performance tests were conducted using a specific transport, specific network protocol, and data format. The results in this article reflect the specific hardware, compiler, API release, ADS/ADH release, and configuration as defined previously in the article. Any deviation from the above environments can affect performance results.
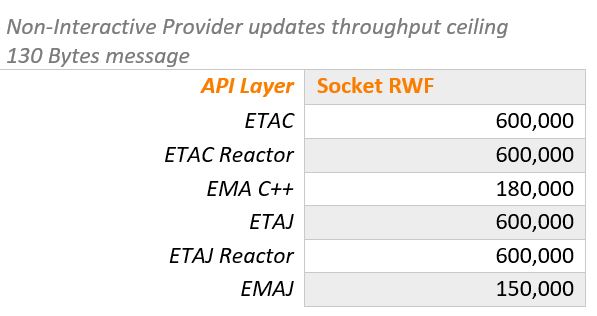
Throughput Ceiling
The following table and graph show the maximum sustained throughput metrics in updates per second (udps) for the following models:
- ETA C and Java.
- ETA C and Java with Reactor allowing for heartbeat management, connection, and item recovery.
- EMA C++ and Java
The higher number of updates per second indicates better performance.
Performance metrics are provided for Socket RWF:
The following graph is a visual representation of the above results.
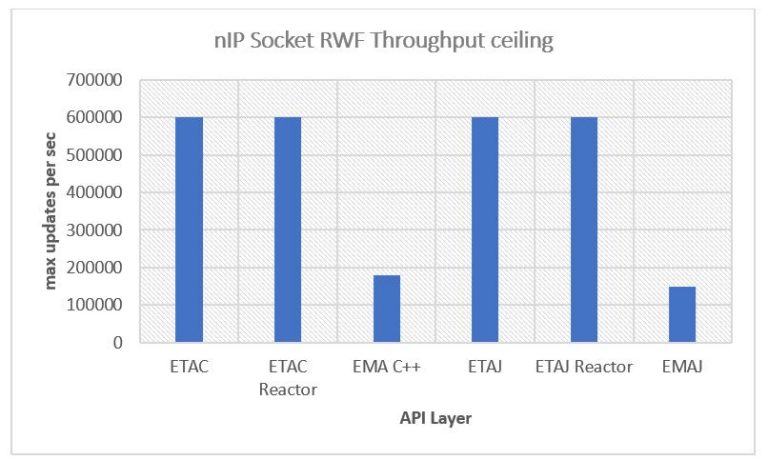
As we can see from the above table and graph for the non-Interactive Provider throughput ceiling performance tests, the ETAC and ETAC Reactor show a consistent high performance at 600,000 message throughputs. ETAJ and ETAJ Reactor have shown equal performance results again at a 600,000 throughput ceiling. EMA C++ and EMAJ follow at 180,000 and 150,000 message throughputs.
Steady State Latency
The following table and graph show maximum Steady State Latency (usec) metrics at 10,000 updates per second (udps) for the following models:
- ETA C and Java.
- ETA C and Java with Reactor allowing for heartbeat management, connection, and item recovery.
- EMA C++ and Java
Values in each cell represent the achieved steady state latency by the component under test (Non-Interactive Providers) in microseconds (usec). Lower latency results in better performance.
Performance metrics are provided for Socket RWF:

The following graph is a visual representation of the above results.
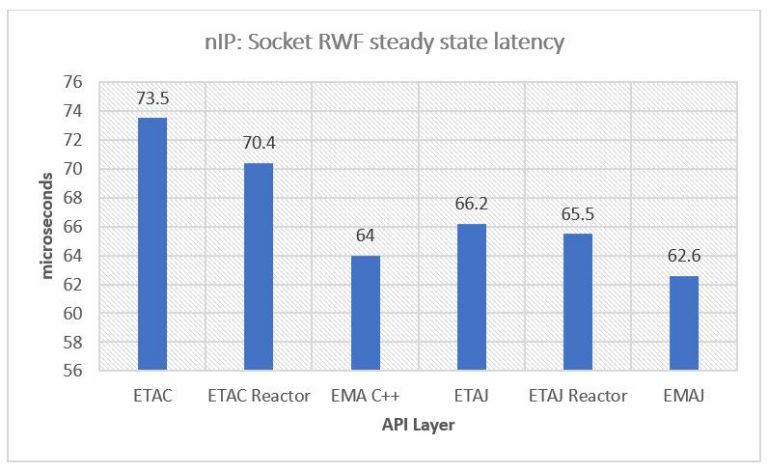
As we can see from the above table and graph for the non-Interactive Provider steady state latency performance tests, the ETA C and ETA C Reactor show consistent low latencies at 73.5 μsecs and 70.4 μsecs. ETA Java and ETA Java Reactor very closely follow with latencies at 66.2msecs and 65.5 μsecs, followed by EMA C++ and EMA Java with slightly higher latencies at 64 μsecs and 62.6 μsecs.
RTSDK C/C++: Average CPU Usage
The following line chart compares the average CPU usage of the Refinitiv Real-Time SDK C/C++ non-interactive provider performance tools (EMA C++, ETA C Reactor, ETA C) versus various update rates for the Socket RWF connection type. When the update rate is constant, lower CPU usage indicates better performance.
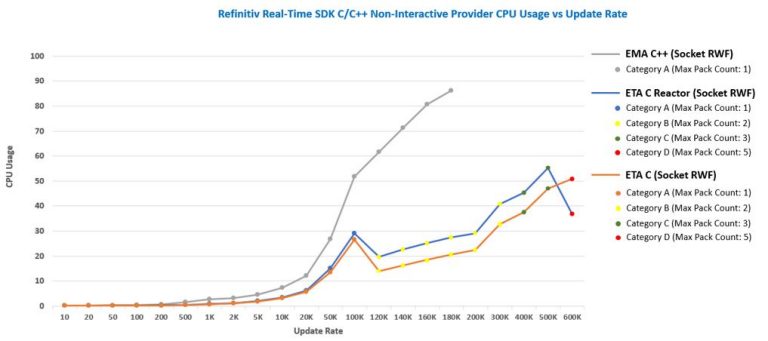
The following points could be extracted from the chart.
- With the same update rate, typically the average CPU usage of EMA C++ is the highest while the average CPU usage of ETA C is the lowest
- At 180K update rate, the average CPU usage of EMA C++ is around 80 percent while the average CPU usage of ETA C is around 20-30 percent
- Changing the category can impact the average CPU usage and update rates. For example, changing from category A to category B at 100K update rate in ETA C can lower the average CPU usage while the update rate is increasing to 120K
- The average CPU usage of the ETA C Reactor is considerably higher than the average CPU usage of ETA when the update rate is 120K and above
For each category setting, please refer to the Refinitiv Real-Time SDK Performance Report.
RTSDK Java: Average CPU Usage
The following line chart compares the average CPU usage of the Refinitiv Real-Time SDK Java non-interactive provider performance tools (EMA Java, ETA Java Reactor, ETA Java) versus various update rates for the Socket RWF connection type. When the update rate is constant, lower CPU usage indicates better performance.
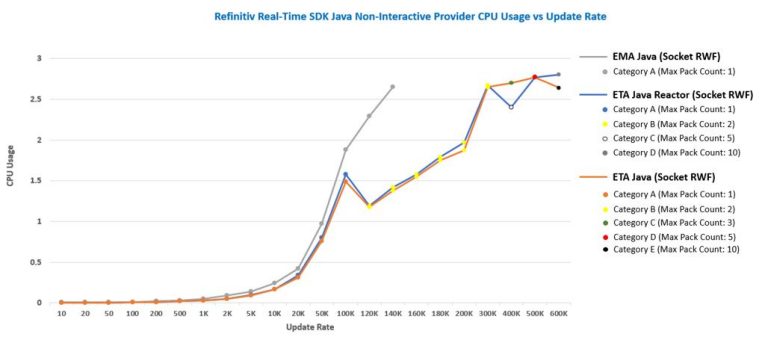
The following points could be extracted from the chart.
- With the same update rate, typically the average CPU usage of EMA Java is the highest while the average CPU usage of ETA Java and ETA Java Reactor is not much different
- Changing the category can impact the average CPU usage and update rates. For example, changing from category A to category B at 100K update rate in ETA Java can lower the average CPU usage while the update rate is increasing to 120K
- Around the average CPU usage of 2.65, EMA Java can publish about 140K updates per second while ETA Java can publish about 600K updates per second
For each category setting, please refer to the Refinitiv Real-Time SDK Performance Report.
Summary
The API product team released the Refinitiv Real-Time SDK (RTSDK) APIs Performance Test Results document that reports performance results for the Refinitiv Real-Time SDK (RTSDK) APIs over different network protocols such as - TCP Socket encrypted and non-encrypted as well as TCP WebSocket encrypted and non-encrypted for two data formats (WebSocket JSON and Websocket RWF). It uses the Performance Test Tools in the Refinitiv Real-Time SDK packages to generate the performance test results.
The results emphasize the design of each API. The Enterprise Transport API (ETA) is designed for performance, so it provides the highest throughput and lowest latency. The Enterprise Message API (EMA) is designed for ease of use, so it provides acceptable performance and it is suitable for most use cases. For example, the ETA C consumer application can handle 1,200,000 updates per second while the EMA C++ consumer application can handle at most 420,000 updates per second.. At the same update rate, the average CPU usage of EMA is the highest while the average CPU usage of ETA is the lowest. Moreover, the results of the throughput ceiling test indicate that the RSSL data format outperforms the JSON data format. This was expected since JSON is designed for easy reading and integration, which introduces some overheads in the process that can affect performance.
Users can use these results as guidelines to select the appropriate APIs to develop applications. However, the results are based on a single application thread. The performance can be improved by using multiple application threads to decode data or using the advanced features in the APIs, such as horizontal scaling, message packing, and batch and dynamic views.
To share your thoughts, comments, or suggestions, please use this channel.
References
- Refinitiv. (2022). Refinitiv Real-Time APIs Open Source Performance Tools Guide
- Refinitiv. (2022). Refinitiv Real-Time APIs Concept Guide
- Refinitiv. (2023). Refinitiv Real-Time SDK (RTSDK) APIs Performance Test Results. https://developers.refinitiv.com/en/api-catalog/refinitiv-real-time-opnsrc/rt-sdk-cc/documentation#performance-report
- Register or Log in to applaud this article
- Let the author know how much this article helped you