

Overview
Every day, we are faced with monumental amounts of data and content from every single direction. This includes everything from articles, posts, tweets, and emails flowing into our inboxes to the hundreds of ever-changing fundamentals around the global commodities complex. With Refinitiv Data Management Solution (RDMS) We enable you to make the best possible use of your data, technology, and human or artificial intelligence. We provide you with access to the most comprehensive, trusted, and up-to-date data on the global commodity markets. Our integrated solution ensures consumption of big data in a logical and structured manner, to extract maximum value from your internal or external data sets at a lower cost.
This article provides a guide to retrieving the commodities Point Connect data via RDMS API using Python programming language (as this is the REST API, any programming language that supports it can be used to make an API call) by demonstrating how to retrieve the temperature data and transforming the JSON responses into a dataframe for further steps such as visualizations or analytics, etc.
Introduction
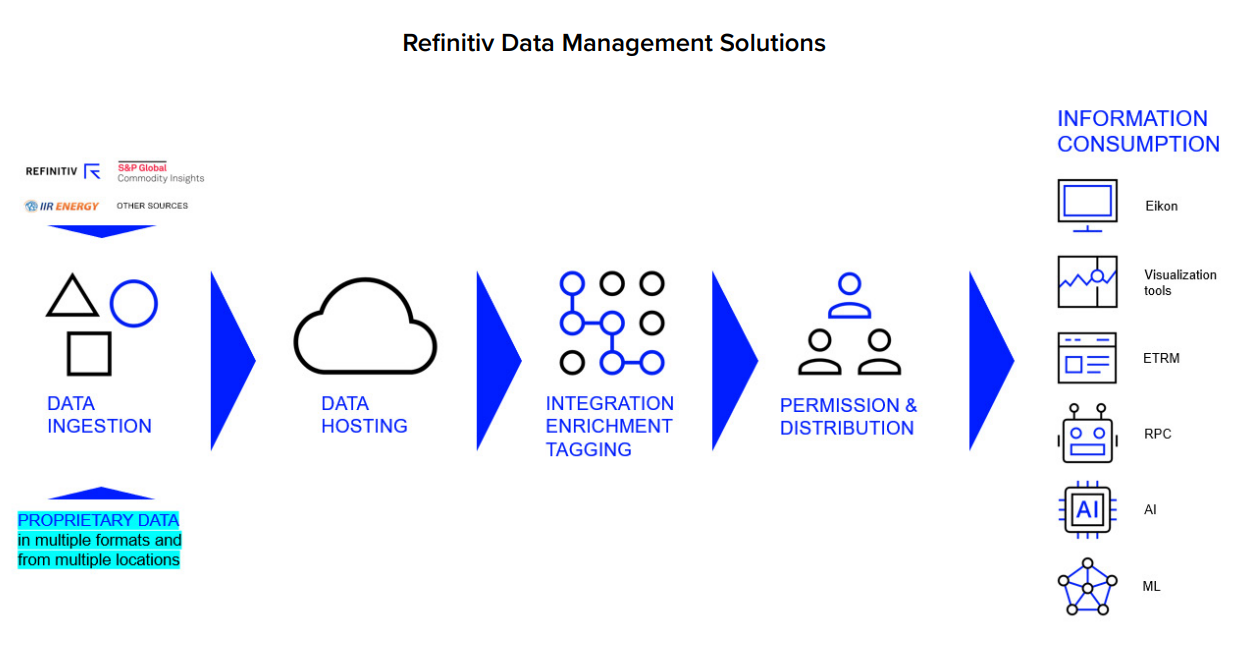
- Refinitiv Data Management Solution (RDMS) is the Cloud-based or in-house infrastructure for streamlined data warehousing
This comprehensive solution comes with the added option of accessing all the information via our platforms or integrating it with in-house visualization or data management systems via an open API framework. This reduces the total cost of ownership (TCO) at your end. This is the most effective solution for companies with exposure to commodities, including Energy companies, Utilities companies, Mining and materials companies, Agriculture and F&B companies, Transportation companies and airlines, and Commodities trading houses.- For RDMS API Overview, Quickstart, and Documentation can be found in the Developer Portal - RDMS
- Refinitiv Point Connect is one of the sources of data that aggregated, normalized along with data from other sources, which can be retrieved using RDMS API
With Refinitiv® Point Connect, you can view fundamental and forecast data for power, gas, agriculture, weather, hydrology, carbon, liquefied natural gas (LNG), and metals. Gain insight from the Refinitiv Research and Forecasts team. See a full history of all data sets, with data delivery over FTP. Receive instant notifications on updated data with your subscription. Point Connect presents data simply in CSV files – and all in our metadata taxonomy for immediate access and context.
Prerequisite
This example requires the below, or you can connect your Refinitiv account representative for further information.
- For permission to access Point Connect data, more detail can be found here.
- Refinitiv Data Management Solutions (RDMS), more detail can be found here. You will get an account to access the specific instance of RDMS that contains the data set that you're interested in. It's recommended to follow the RDMS REST API Quick Start Guide to do the User Setup, Registration, Manage your account, Access the RDMS Administrator Web Application, and Access the RDMS Swagger REST API Page.
The guide to generating the RDMS API key, which is required for accessing data via RDMS API, is also provided in the quick start guide. - You also need an internet connection to connect to RDMS.
- The tool for an API call, here we're using Python version 3.9.12 with these Python libraries
- requests==2.27.1
- pandas==1.3.5
When all required prerequisites are ready, let's go to the next step to retrieve the data we want!
Point Connect Data Retrieval via RDMS API
In the RDMS web application, we're searching for the data we're interested in. Here I search for temperature data and pick the curve ID 103424068 for the demonstration.
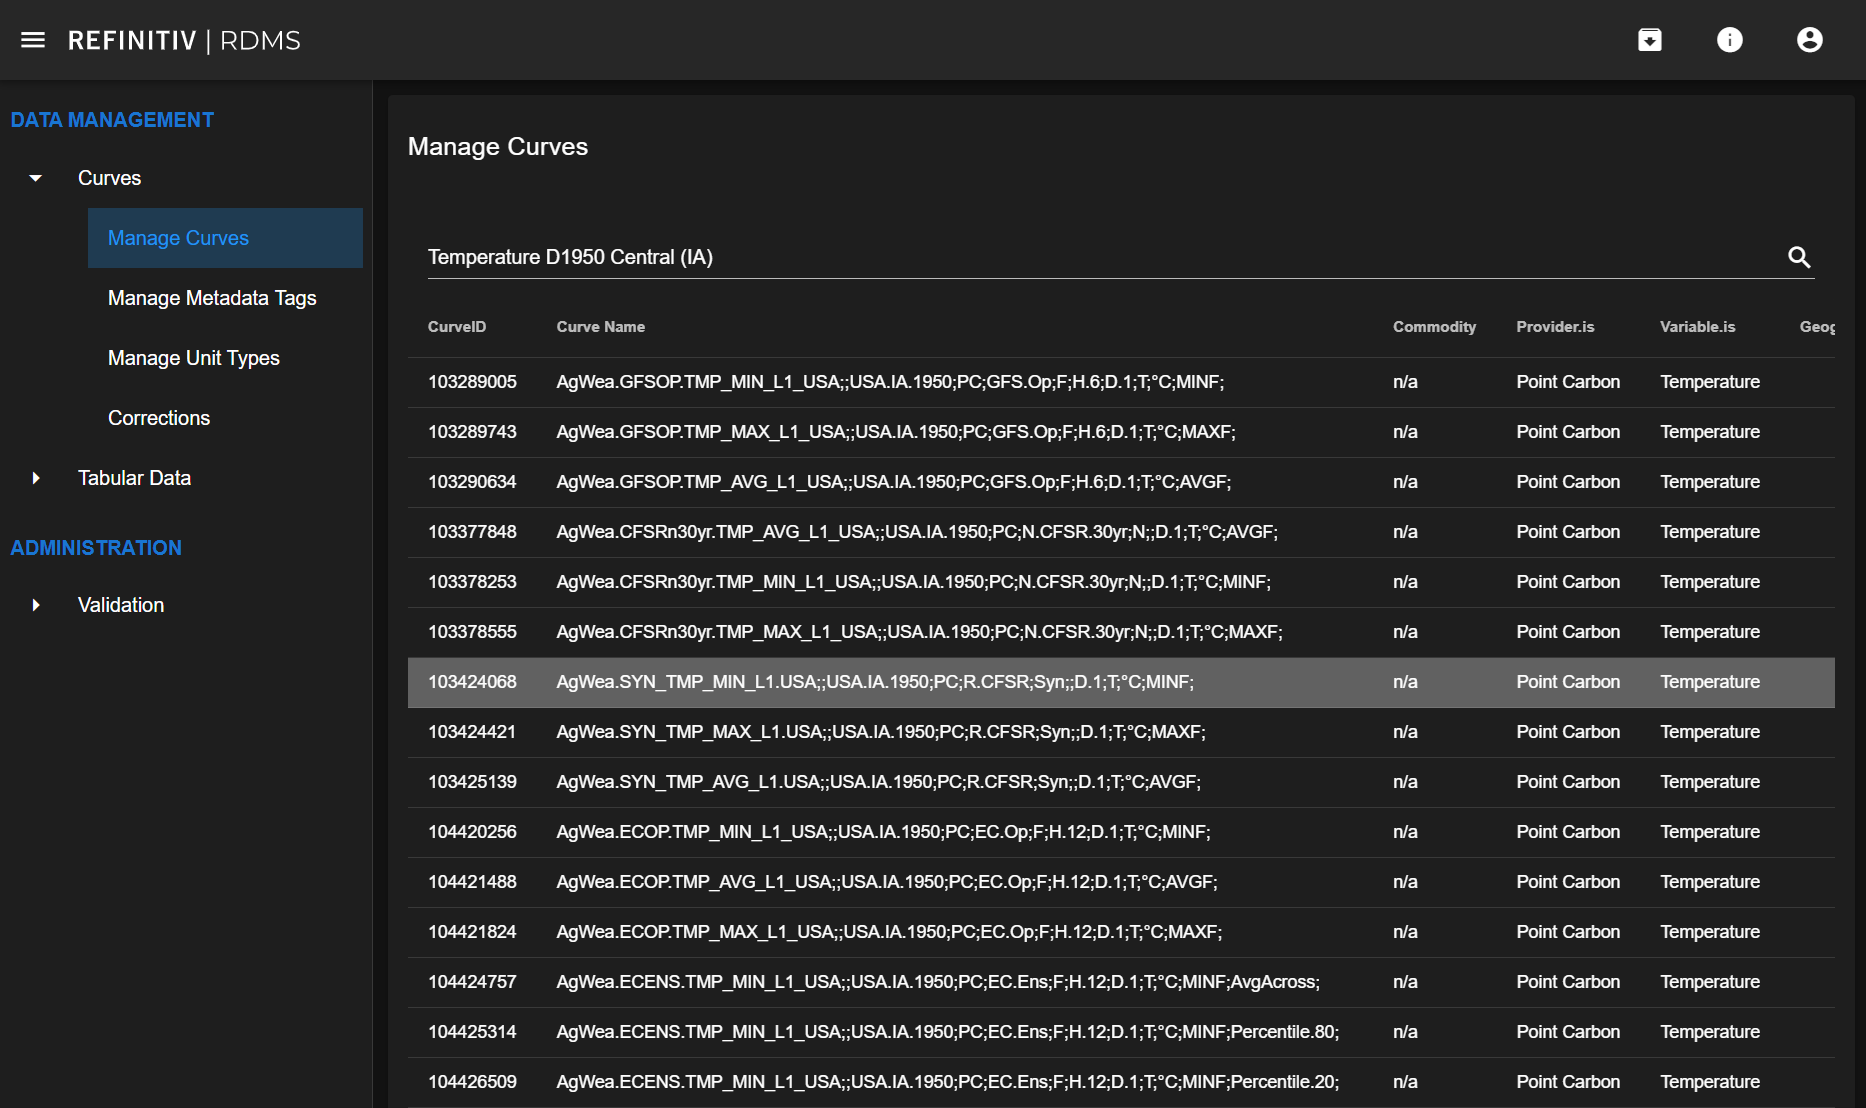
With this curve ID, its metadata can be retrieved with an endpoint /v1/Metadata/ that lists all available metadata for the given CurveID. Note that only the metadata tags that have values for this curve are included, so calls for different CurveIDs may yield different sets of columns.
First, import necessary libraries and declare variables required for API calls.
- You need to replace the your-rdms-instance with your valid RDMS instance and put your valid application key here. You can change the Curve ID here as well, in this case, I use the Curve ID picked from the step above.
import requests
base_url = 'https://your-rdms-instance.rdms.refinitiv.com/api'
api_key = '## YOUR API KEY ##'
payload={}
headers = {
'accept': 'text/plain',
'Authorization': api_key
}
curve_id = '103424068'
scenario_id = '0'
Then, retrieve the metadata from the metadata endpoint and print the JSON response on the console.
url = base_url + '/v1/Metadata/' + curve_id
response = requests.request('GET', url, headers=headers, data=payload)
print(response.json())
Here's the metadata endpoint's response in JSON format
{'curveID': 103424068,
'tags': [{'name': 'Curve Name',
'value': 'AgWea.SYN_TMP_MIN_L1.USA;;USA.IA.1950;PC;R.CFSR;Syn;;D.1;T;°C;MINF;'},
{'name': 'Commodity', 'value': 'n/a'},
{'name': 'Provider.is', 'value': 'Point Carbon'},
{'name': 'Variable.is', 'value': 'Temperature'},
{'name': 'Geography.is', 'value': 'D1950 Central (IA)'},
{'name': 'Value.Frequency.is', 'value': 'Days (1)'},
{'name': 'Status.is', 'value': 'Synthetic'},
{'name': 'Unit.is', 'value': 'degree Celcius'},
{'name': 'FileFolder',
'value': 'History/Global_Agriculture/Weather/Temp/Timeseries'},
{'name': 'FileStub', 'value': 'HIST_AgsWea_TR_Temp_MIN_L1_USA_A'},
{'name': 'FileID', 'value': '5032457'},
{'name': 'Source', 'value': 'PointConnect'},
{'name': 'Provider', 'value': 'Point Carbon'},
{'name': 'Unit', 'value': 'degC'},
{'name': 'Dataset.In.is', 'value': 'Climate Forecast System Reanalysis'},
{'name': 'Issue.Frequency.is', 'value': 'Days (1)'},
{'name': 'Dataset.Out.is', 'value': 'AgWea Level 1'},
{'name': 'Value.Aggregation.is', 'value': 'Minimum (resolution)'}]}
There are several ways to retrieve the geography of the data. For example, the code below provides the output 'D1950 Central (IA)'
curve_metadata['tags'][4]['value']
The available endpoints on the RDMS instance with its applicable parameters and description can be found in the RDMS API Swagger page at https://your-rdms-instance.rdms.refinitiv.com/api/swagger/index.html (replace your-rdms-instance with your valid RDMS instance)
This is an example of the endpoint to get Curve Values data that returns raw values for the supplied CurveID, optionally restricted by any of the other parameters
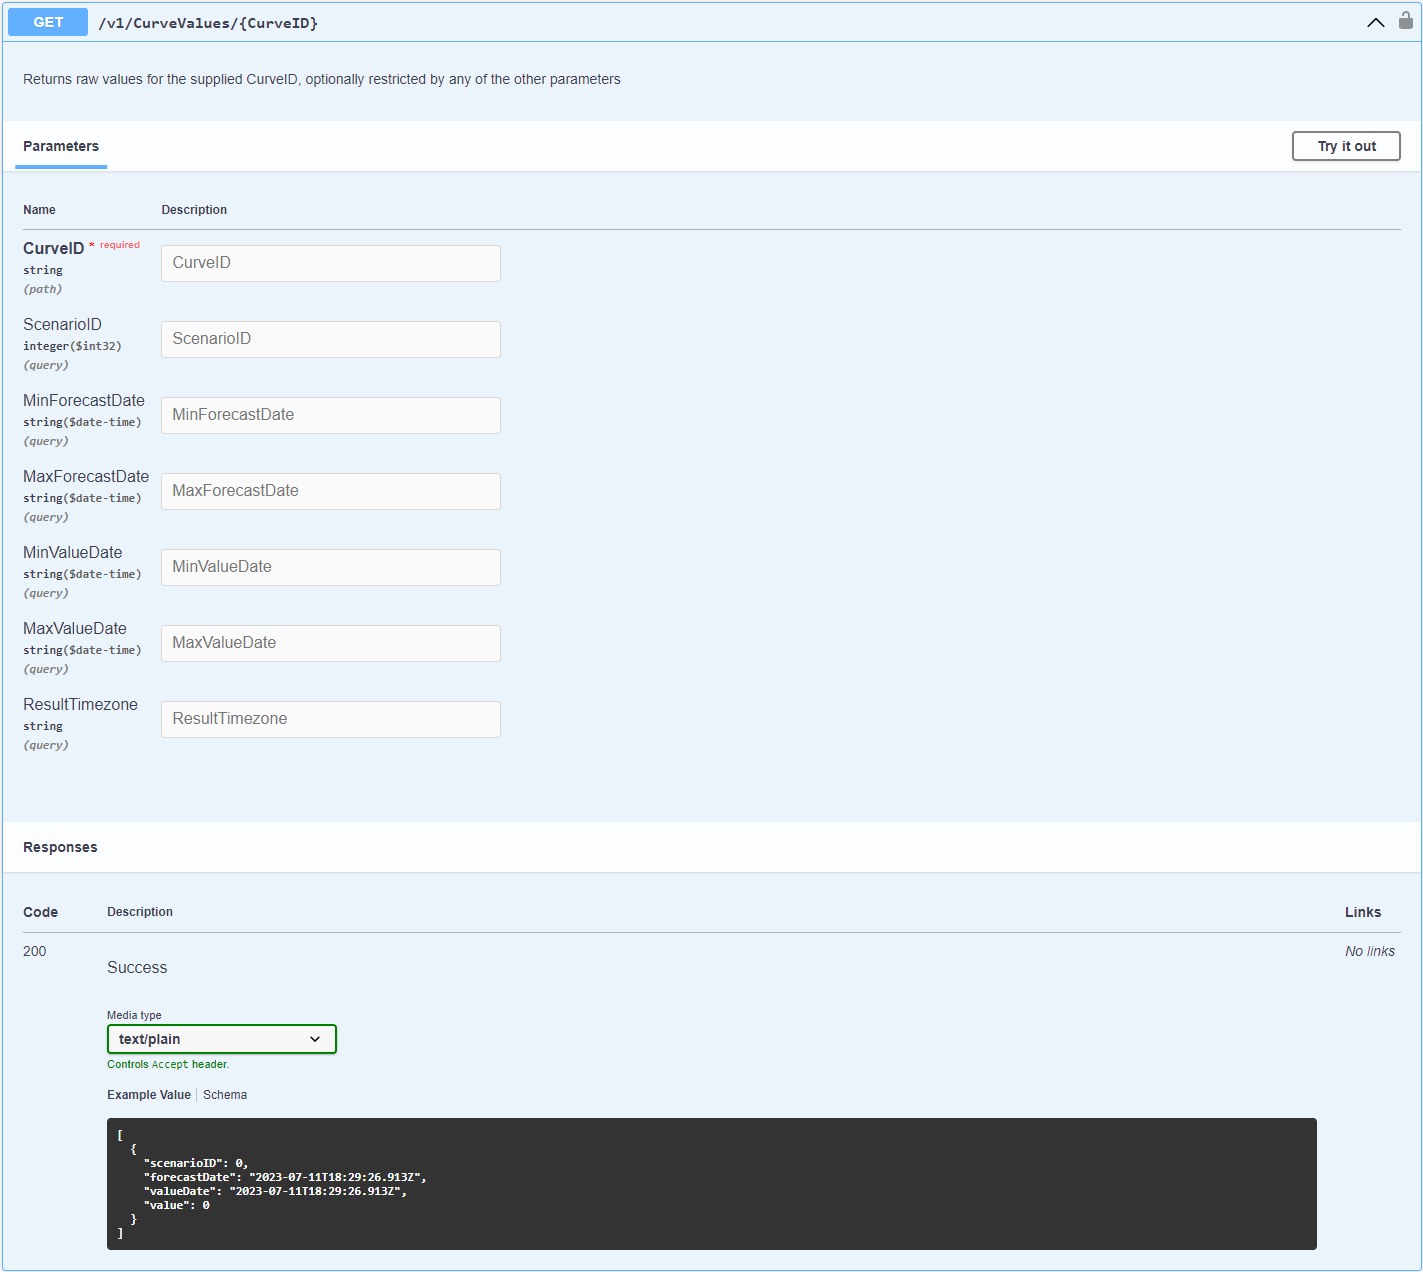
Below is an example code to call the CurveValues endpoint with some optional parameters (Scenario ID, Min Forecast Date, Max Forecast Date) then print the response as JSON format
min_forecast_date = '2023-05-20T00:00:00'
max_forecast_date = '2023-06-15T00:00:00'
url = base_url + f'/v1/CurveValues/{curve_id}?ScenarioID={scenario_id}&MinForecastDate={min_forecast_date}&MaxForecastDate={max_forecast_date}'
response = requests.request('GET', url, headers=headers, data=payload)
response.json()
Here's the response
[{'scenarioID': 0,
'forecastDate': '2023-05-20T00:00:00+00:00',
'valueDate': '2023-05-20T00:00:00+00:00',
'value': 22.5},
{'scenarioID': 0,
'forecastDate': '2023-05-20T00:00:00+00:00',
'valueDate': '2023-05-21T00:00:00+00:00',
'value': 22.0},
..
.
.
,
{'scenarioID': 0,
'forecastDate': '2023-06-05T06:00:00+00:00',
'valueDate': '2023-06-13T00:00:00+00:00',
'value': 21.9},
...]
You can check the code to retrieve temperature curve data with other RDMS endpoints in the file rdms-pointconnect-temperature.ipynb in this GitHub repository.
Now we have already learned how to retrieve the data using RDMS API. Next, let's go through the example together, it's the use case to retrieve temperature data in multiple geographies and convert the data from JSON format to Pandas dataframe for further visualization or analysis.
Example use case
Transforming temperature data in API responses to the dataframe
Retrieve data of multiple curves, convert to pandas dataframe, and merge them together using value_date.
First, import necessary libraries, declare the variables required for API calls, and do the below
- Replace '## YOUR API KEY ##' with your RDMS API Key
- Declare the curve_id_list with curve IDs that you want to retrieve the data
- Replace your-rdms-instance with your RDMS instance
import requests
import pandas as pd
api_key = '## YOUR API KEY ##'
curve_id_list = ['103425139','103425132','103425133','103425135','103425137','103425140','103425142','103425144','103425145']
base_url = 'https://your-rdms-instance.rdms.refinitiv.com/api'
payload={}
headers = {
'accept': 'text/plain',
'Authorization': api_key
}
Implement the function to get each metadata tag value of the Curve ID. The output of this function to print Curve ID, Curve Name, and Curve Geography is shown below
def get_metadata(curve_id, tag):
""" This function call the metadata endpoint and get specific metadata tag of the curve_id"""
url = base_url + '/v1/Metadata/' + curve_id
response = requests.request('GET', url, headers=headers, data=payload)
curve_metadata = response.json()
tag_name = [metadata_tag['name'] for metadata_tag in curve_metadata['tags']]
tag_index = tag_name.index(tag)
tag_value = curve_metadata['tags'][tag_index]['value']
return tag_value
# Here's an example of the usage of function get_metadata
# Print out curve ID, Curve Name and Geography.is (from the response of metadata endpoint)
for curve_id in curve_id_list:
print(curve_id + ": " + get_metadata(curve_id,'Curve Name') + get_metadata(curve_id,'Geography.is'))
103425139: AgWea.SYN_TMP_AVG_L1.USA;;USA.IA.1950;PC;R.CFSR;Syn;;D.1;T;°C;AVGF;D1950 Central (IA)
103425132: AgWea.SYN_TMP_AVG_L1.USA;;USA.IA.1910;PC;R.CFSR;Syn;;D.1;T;°C;AVGF;D1910 Northwest (IA)
103425133: AgWea.SYN_TMP_AVG_L1.USA;;USA.IA.1920;PC;R.CFSR;Syn;;D.1;T;°C;AVGF;D1920 North Central (IA)
103425135: AgWea.SYN_TMP_AVG_L1.USA;;USA.IA.1930;PC;R.CFSR;Syn;;D.1;T;°C;AVGF;D1930 Northeast (IA)
103425137: AgWea.SYN_TMP_AVG_L1.USA;;USA.IA.1940;PC;R.CFSR;Syn;;D.1;T;°C;AVGF;D1940 West Central (IA)
103425140: AgWea.SYN_TMP_AVG_L1.USA;;USA.IA.1960;PC;R.CFSR;Syn;;D.1;T;°C;AVGF;D1960 East Central (IA)
103425142: AgWea.SYN_TMP_AVG_L1.USA;;USA.IA.1970;PC;R.CFSR;Syn;;D.1;T;°C;AVGF;D1970 Southwest (IA)
103425144: AgWea.SYN_TMP_AVG_L1.USA;;USA.IA.1980;PC;R.CFSR;Syn;;D.1;T;°C;AVGF;D1980 South Central (IA)
103425145: AgWea.SYN_TMP_AVG_L1.USA;;USA.IA.1990;PC;R.CFSR;Syn;;D.1;T;°C;AVGF;D1990 Southeast (IA)
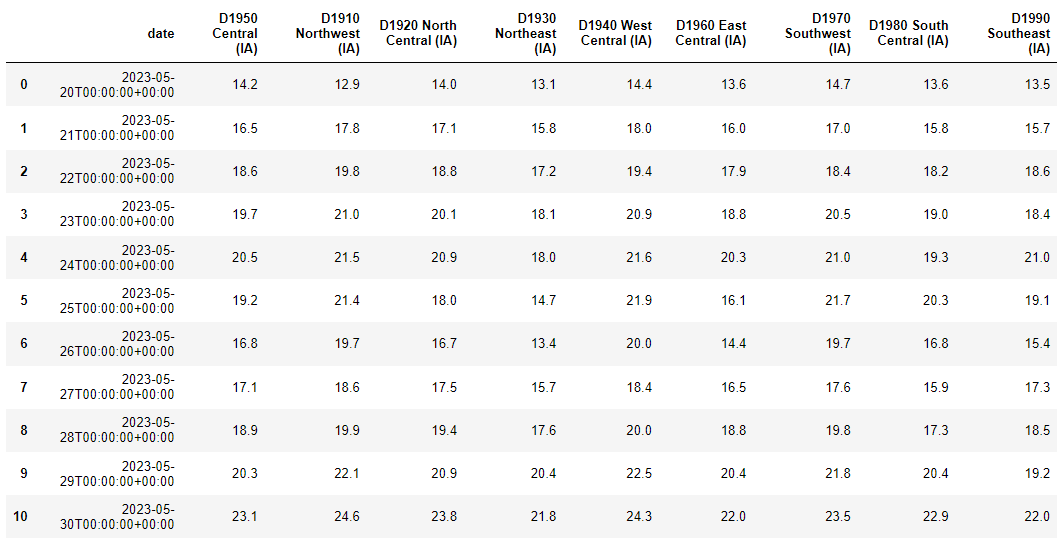
Next, let's retrieve the data during 20 - 30 May 2023 of Curve in curve_id_list with min and max value date parameters to limit the response to only the interested date range. Then convert the JSON response to Pandas dataframe and merge them together on the date value.
# set the min and max value date of the data
min_value_date = '2023-05-20T00:00:00'
max_value_date = '2023-05-30T00:00:00'
# create empty dataframe to store the result
output_df = pd.DataFrame()
for curve_id in curve_id_list:
# for each curve ID in curve ID list
# get geography metadata of curve ID and stored into variable curve_geography, to be used as a column name
curve_geography = get_metadata(curve_id,'Geography.is')
# Get curve value data
# set the url with parameters (more parameters can be added, check available parameters in the RDMS API Swagger)
url = base_url + f'/v1/CurveValues/{curve_id}?MinValueDate={min_value_date}&MaxValueDate={max_value_date}'
response = requests.request('GET', url, headers=headers, data=payload)
# Convert response from JSON format to pandas dataframe
df = pd.json_normalize(response.json())
# Drop unused columns and rename the columns
df.drop(['scenarioID', 'forecastDate'], axis=1, inplace=True)
df.rename(columns={'valueDate': 'date', 'value': curve_geography}, inplace=True)
#display(df)
# Put the df into output_df, merge dataframes together using date column
if output_df.empty:
output_df = output_df.append(df, ignore_index=True)
else:
output_df = output_df.merge(df, how='inner', on='date')
# Display final output dataframe
display(output_df)
Here's the result, the Jupyter Notebook file of this example can be found in this GitHub repository (file named rdms-pointconnect-curve-df.ipynb)
Conclusion
Our exploration of the RDMS API and Point Connect has demonstrated the immense potential of commodities data, specifically temperature data, for a wide range of applications. By learning to retrieve and transform this data into a dataframe format, you've gained a powerful tool for further analysis, and visualizations, and also easy to read by humans.
While this article demonstrated how to get temperature data, the skills you've acquired here can be applied to various other data types. So, whether you're a data scientist, financial analyst, or data enthusiast, the possibilities are now here for you to further explore and harness the power of commodities data. The journey doesn't end here, keep experimenting, keep analyzing, and keep discovering new insights! and if you have any questions regarding our API usage, feel free to check our Q&A forum or post the question there to get in touch. For questions related to the product or content, please raise a ticket via MyRefinitiv and the support team is going to reach out to you to assist with this. I hope you find this article helpful and please let me know if you have any use case you're interested to see its related article or code example.
Reference
- Dev Portal - Refinitiv Data Management Solution (RDMS)
- RDMS Web Application: https://your-rdms-instance.rdms.refinitiv.com/
- Generate API key: https://your-rdms-instance.rdms.refinitiv.com/Identity/Account/Manage/ApiKeys
- RDMS swagger: https://your-rdms-instance.rdms.refinitiv.com/api/swagger/index.html
- Q&A forum
- Register or Log in to applaud this article
- Let the author know how much this article helped you