
Author:

Data Engineering is a necessary prerequisite before doing any serious quantitative research. Some quants work with separate data engineering teams for their data needs while other quants do it all themselves. At StarMine Research, we fall on the scrappier side and usually have to do our own data ETL (extract, transform, load) before we can proceed with our quantitative research. Thankfully, pretty much all of our content sets are sourced from Refinitiv / LSEG, so they’re easy to consume and consistently mapped. I’d like to share my journey of integrating Refinitiv ESG, including the newly released point-in-time version, into an existing quantitative finance model that had previously only used traditional financial data.
The StarMine Smart Holdings model is a behavioral finance model which calculates individual factor preference profiles for large hedge funds and active mutual funds based on their recent purchases. It ranks stocks based on how attractive each stock currently is to those Smart Money investors. Fund Managers tend to buy companies with particular characteristics, including fundamental or technical factors such as price-to-earnings, debt-to-equity or price momentum. With 25 financial factors covering 7 factor categories, there are very robust multi-factor considerations underlying our main behavioral finance approach. The wisdom of the Smart Money crowd is captured by each owner’s behavioral profile "voting" on every publicly tradeable stock, based on how appealing the stock's current factors and recent factor changes are to that individual owner. The model then aggregates what’s popular across all funds to arrive at a bearish-to-bullish 1-100 stock ranking.
With model live in production for over a decade, we felt it was time to work on a Smart Holdings 2.0 that considers other factors that matter to asset managers and mutual funds. If you’ve been following ESG at all, then you’ve no doubt been bombarded with news stories exclaiming an ever-increasing amount of money going towards sustainable investing. And if your finger has been on the pulse of academic research in this space, you’re probably aware that finding alpha with ESG can be challenging. Unless, of course, you overlay ESG considerations with traditional financial approaches, where there has been some documented success. Hence leading to our inspiration for ESG Smart Holdings, where we seek to find ESG factors which add value to the traditional financial factors used in our Smart Holdings 1.0 model.
I started my research for ESG Smart Holdings in early 2021, before the ESG Point-in-Time content was available. I used the regular ESG content set, sourced from RDP Bulk. RDP stands for the Refinitiv Data Platform, which hosts a centralized collection of APIs to access Refinitiv content sets. The “Bulk” is a special flavor of RDP where you can download deep complete histories of a content set, often spanning multiple large files. Here is an article in the Refinitiv Developer Community that shows an example of how to download from RDP Bulk with some simple Python code.
My preferred quant research environment is Amazon Web Services (AWS) since my data needs can get quite big and AWS offers many services which scale to meet those needs. The Bulk Files from RDP integrate very cleanly into AWS. After downloading and unzipping the files, I upload each file of a similar category to its own S3 directory. I then run an AWS Glue Crawler to derive the schema, which creates an AWS Athena table. I’m quite comfortable using Athena and can query the newly loaded content with some simple SQL. While Refinitiv’s ESG content has over 500 different data points, my research was focused on just a subset of ESG factors. I’ll often use a CREATE TABLE AS (CTAS) SQL statement against Athena to grab the exact data points I want, from several different tables, into one combined table for easier of use. And when I run a CTAS statement, I prefer the Parquet storage format since it is self-descriptive and conducive to loading directly into Python code.
The following is the Athena schema created by an AWS Glue Crawler from the RFT-ESG-Scores-Full-Init-*.jsonl files and contains the top 3 levels of scores (e.g. ESG Score, Environment Pillar, Emissions Category). It is also available in the accompanying git repo as create_rdp_scores.sql.
CREATE EXTERNAL TABLE `rdp_scores`(
`objectid` string COMMENT 'from deserializer',
`statementdetails` struct<organizationid:string,financialperiodenddate:string,financialperiodfiscalyear:string,financialperiodisincomplete:string> COMMENT 'from deserializer',
`esgorganization` struct<names:struct<name:struct<organizationname:array<struct<organizationnormalizedname:string>>>>> COMMENT 'from deserializer',
`esgscores` struct<esgcombinedscore:struct<value:string,valuecalculationdate:string,valuescoregrade:string>,esgscore:struct<value:string,valuecalculationdate:string,valuescoregrade:string>,environmentpillarscore:struct<value:string,valuecalculationdate:string,valuescoregrade:string>,esgresourceusescore:struct<value:string,valuecalculationdate:string,valuescoregrade:string>,esgemissionsscore:struct<value:string,valuecalculationdate:string,valuescoregrade:string>,esginnovationscore:struct<value:string,valuecalculationdate:string,valuescoregrade:string>,socialpillarscore:struct<value:string,valuecalculationdate:string,valuescoregrade:string>,esgworkforcescore:struct<value:string,valuecalculationdate:string,valuescoregrade:string>,esghumanrightsscore:struct<value:string,valuecalculationdate:string,valuescoregrade:string>,esgcommunityscore:struct<value:string,valuecalculationdate:string,valuescoregrade:string>,esgproductresponsibilityscore:struct<value:string,valuecalculationdate:string,valuescoregrade:string>,governancepillarscore:struct<value:string,valuecalculationdate:string,valuescoregrade:string>,esgmanagementscore:struct<value:string,valuecalculationdate:string,valuescoregrade:string>,esgshareholdersscore:struct<value:string,valuecalculationdate:string,valuescoregrade:string>,esgcsrstrategyscore:struct<value:string,valuecalculationdate:string,valuescoregrade:string>,esgccontroversiesscore:struct<value:string,valuecalculationdate:string,valuescoregrade:string>> COMMENT 'from deserializer',
`diversityandinclusionscores` struct<controversiesscore:struct<value:string,valuecalculationdate:string>,diversityscore:struct<value:string,valuecalculationdate:string>,inclusionscore:struct<value:string,valuecalculationdate:string>,peopledevelopmentscore:struct<value:string,valuecalculationdate:string>,score:struct<value:string,valuecalculationdate:string>> COMMENT 'from deserializer')
ROW FORMAT SERDE
'org.openx.data.jsonserde.JsonSerDe'
WITH SERDEPROPERTIES (
'paths'='DiversityAndInclusionScores,ESGOrganization,ESGScores,ObjectId,StatementDetails')
STORED AS INPUTFORMAT
'org.apache.hadoop.mapred.TextInputFormat'
OUTPUTFORMAT
'org.apache.hadoop.hive.ql.io.HiveIgnoreKeyTextOutputFormat'
LOCATION
's3:/YOUR_BUCKET/data/repo/esg/rdp_scores/'
;
The following is the Athena schema created from the RFT-ESG-Raw-Full-SchemeB-Env-Init-*.jsonl files and has granular Level 4 data points for Environmental factors and Governance factors (e.g. CO2/Revenue, Non-Audit Fees / Audit Fees). I have given an abridged schema here - the full version is available in the accompanying git repo as create_rdp_env_gov.sql.
CREATE EXTERNAL TABLE `rdp_env_gov`(
`objectid` string COMMENT 'from deserializer',
`statementdetails` struct<organizationid:string,financialperiodenddate:string,financialperiodfiscalyear:string,financialperiodisincomplete:string,esgoratdindicator:string> COMMENT 'from deserializer',
`esgorganization` struct<names:struct<name:struct<organizationname:array<struct<organizationnormalizedname:string>>>>> COMMENT 'from deserializer',
`csrstrategydatapoints` struct<csrsustainabilitycommittee:struct<value:boolean,valuedate:string,valuescore:string,sources:array<struct<sourceid:int>>>,csrsustainabilityexternalaudit:struct<value:boolean,valuedate:string,valuescore:string,sources:array<struct<sourceid:int>>>,csrsustainabilityexternalauditorname:struct<value:string,valuedate:string,asreported:array<string>,sources:array<struct<sourceid:int>>>,csrsustainabilityreportglobalactivities:struct<value:boolean,valuedate:string,valuescore:string,sources:array<struct<sourceid:int>>>,csrsustainabilityreporting:struct<value:boolean,valuedate:string,valuescore:string,sources:array<struct<sourceid:int>>>,esgperiodlastupdatedate:struct<value:string,valuedate:string,asreported:array<string>,sources:array<string>>,esgreportingscope:struct<value:string,valuedate:string,asreported:array<string>,sources:array<struct<sourceid:int>>>,globalcompactsignatory:
/// This is an abridged version - please see full schema in Repo///
votingcappercentage:struct<value:string,valuedate:string,valuescore:string,asreported:array<string>,sources:array<struct<sourceid:int>>>,writtenconsentrequirements:struct<value:boolean,valuedate:string,sources:array<struct<sourceid:int>>>> COMMENT 'from deserializer',
`shareholdersindicators` struct<accountingcontroversies:struct<value:boolean,valuedate:string>,antitakeoverdevicesabovetwo:struct<value:int,valuedate:string,valuescore:string>,equalshareholderrights:struct<value:boolean,valuedate:string,valuescore:string>,insiderdealingscontroversies:struct<value:boolean,valuedate:string>,litigationexpensestorevenues:struct<litigationexpensestorevenuescurrencyiddescription:string,value:string,valuedate:string,valuescore:string>,nonaudittoauditfeesratio:struct<value:string,valuedate:string,valuescore:string>,shareholderrightspolicy:struct<value:boolean,valuedate:string,valuescore:string>> COMMENT 'from deserializer')
ROW FORMAT SERDE
'org.openx.data.jsonserde.JsonSerDe'
WITH SERDEPROPERTIES (
'paths'='CsrStrategyDataPoints,ESGOrganization,EmissionDataPoints,EmissionIndicators,InnovationDataPoints,InnovationIndicators,ManagementDataPoints,ManagementIndicators,ObjectId,ResourceUseDataPoints,ResourceUseIndicators,ShareholdersDataPoints,ShareholdersIndicators,StatementDetails')
STORED AS INPUTFORMAT
'org.apache.hadoop.mapred.TextInputFormat'
OUTPUTFORMAT
'org.apache.hadoop.hive.ql.io.HiveIgnoreKeyTextOutputFormat'
LOCATION
's3://YOUR_BUCKET/data/repo/esg/rdp_env/'
;
The following is the Athena schema created from the RFT-ESG-Raw-Full-SchemeB-Social-Init-*.jsonl files and has granular Level 4 data points for Social factors (e.g. % Women Managers). I have given an abridged version here - the full schema is available in the accompanying github repo as create_rdp_social.sql.
CREATE EXTERNAL TABLE `rdp_social`(
`objectid` string COMMENT 'from deserializer',
`statementdetails` struct<organizationid:string,financialperiodenddate:string,financialperiodfiscalyear:string,financialperiodisincomplete:string,esgoratdindicator:string> COMMENT 'from deserializer',
`esgorganization` struct<names:struct<name:struct<organizationname:array<struct<organizationnormalizedname:string>>>>> COMMENT 'from deserializer',
`communitydatapoints` struct<anticompetitioncontroversiescount:struct<value:int,valuedate:string,asreported:array<string>,sources:array<struct<sourceid:int>>>,businessethicscontroversies:struct<value:int,valuedate:string,asreported:array<string>,sources:array<struct<sourceid:int>>>,communitylendingandinvestments:struct<communitylendingandinvestmentscurrencyiddescription:struct<identifier:struct<identifiertype:array<struct<identifierdata:array<struct<value:string>>>>>>,value:string,valuedate:string,valuescore:string,asreported:array<string>,sources:array<struct<sourceid:int>>>,corporateresponsibilityawards:struct<value:boolean,valuedate:string,valuescore:string,sources:array<struct<sourceid:int>>>,crisismanagementsystems:struct<value:boolean,valuedate:string,sources:array<struct<sourceid:int>>>,criticalcountriescontroversies:struct<value:string,valuedate:string,asreported:array<string>,sources:array<string>>,criticalcountry1:struct<criticalcountry1iso:struct<identifier:struct<identifiertype:array<struct<identifierdata:array<struct<value:string>>>>>>,valuedate:string,valuescore:string,asreported:array<string>,sources:array<struct<sourceid:int>>>,criticalcountry2:struct<criticalcountry2iso:struct<identifier:struct<identifiertype:array<struct<identifierdata:array<struct<value:string>>>>>>,valuedate:string,asreported:array<string>,sources:array<string>>,criticalcountry3:struct<criticalcountry3iso:struct<identifier:struct<identifiertype:array<struct<identifierdata:array<struct<value:string>>>>>>,valuedate:string,asreported:array<string>,sources:array<stri
/// This is an abridged version - please see full schema in Repo ///
`workforceindicators` struct<announcedlayoffstototalemployees:struct<value:string,valuedate:string,valuescore:string>,healthandsafetypolicy:struct<value:boolean,valuedate:string,valuescore:string>,injuriestomillionhours:struct<value:string,valuedate:string,valuescore:string>,lostdaystototaldays:struct<value:string,valuedate:string,valuescore:string>,netemploymentcreation:struct<value:string,valuedate:string,valuescore:string>,salarygap:struct<value:string,valuedate:string,valuescore:string>,traininganddevelopmentpolicy:struct<value:boolean,valuedate:string,valuescore:string>,trainingcostsperemployee:struct<trainingcostsperemployeecurrencyiddescription:struct<identifier:struct<identifiertype:array<struct<identifierdata:array<struct<value:string>>>>>>,value:string,valuedate:string,valuescore:string>,wagesworkingconditioncontroversies:struct<value:boolean,valuedate:string>> COMMENT 'from deserializer')
ROW FORMAT SERDE
'org.openx.data.jsonserde.JsonSerDe'
WITH SERDEPROPERTIES (
'paths'='CommunityDataPoints,CommunityIndicators,ESGOrganization,HumanRightsDataPoints,HumanRightsIndicators,ObjectId,ProductResponsibilityDataPoints,ProductResponsibilityIndicators,StatementDetails,WorkforceDataPoints,WorkforceIndicators')
STORED AS INPUTFORMAT
'org.apache.hadoop.mapred.TextInputFormat'
OUTPUTFORMAT
'org.apache.hadoop.hive.ql.io.HiveIgnoreKeyTextOutputFormat'
LOCATION
's3://YOUR_BUCKET/data/repo/esg/rdp_social/'
;
Then for ease of use, I created one massive Athena table from those 3 tables with the ESG factors available using the following SQL Script - I have given an abridged version here but the full version is available in the github repo as create_rdp_esg_all_factors.sql. The 3 prior tables query against the native JSON format used by the ESG RDP Bulk, so there’s a lot of JSON nesting to access the data (e.g. eg.EmissionIndicators.TotalCO2EquivalentsEmissionsToRevenues.value). Whereas in my combined table, I flatten it and store in the highly convenient Parquet format.
CREATE TABLE rdp_esg_all_factors
WITH (format = 'Parquet', parquet_compression = 'SNAPPY', external_location ='s3://YOUR_BUCKET/data/repo/esg/rdp_esg_all_factors')
AS
SELECT r.statementdetails.organizationid,
r.esgorganization.names.name.organizationname[1].organizationnormalizedname AS name,
DATE(SUBSTRING(r.statementdetails.financialperiodenddate,1,10)) AS financialperiodenddate,
r.esgscores.esgcombinedscore.value AS esgcombinedscore,
r.esgscores.esgscore.value AS esgscore,
r.esgscores.esgccontroversiesscore.value AS esgccontroversiesscore,
r.esgscores.environmentpillarscore.value AS environmentpillarscore,
r.esgscores.esgresourceusescore.value AS esgresourceusescore,
r.esgscores.esgemissionsscore.value AS esgemissionsscore,
r.esgscores.esginnovationscore.value AS esginnovationscore,
r.esgscores.socialpillarscore.value AS socialpillarscore,
r.esgscores.esgworkforcescore.value AS esgworkforcescore,
r.esgscores.esghumanrightsscore.value AS esghumanrightsscore,
r.esgscores.esgcommunityscore.value AS esgcommunityscore,
r.esgscores.esgproductresponsibilityscore.value AS esgproductresponsibilityscore,
r.esgscores.governancepillarscore.value AS governancepillarscore,
/// This is an abridged version please see full version in repo ///
s.ProductResponsibilityDataPoints.PorkProducts.value AS PorkProducts,
s.ProductResponsibilityDataPoints.RevenuesFromPorkProducts.value AS RevenuesFromPorkProducts,
s.ProductResponsibilityDataPoints.AlcoholRetailing.value AS AlcoholRetailing,
s.ProductResponsibilityDataPoints.TobaccoRetailing.value AS TobaccoRetailing,
s.ProductResponsibilityDataPoints.PolicyCyberSecurity.value AS PolicyCyberSecurity,
s.ProductResponsibilityDataPoints.AnimalWellbeing.value AS AnimalWellbeing,
s.WorkforceDataPoints.AverageEmployeeLengthOfService.value AS AverageEmployeeLengthOfService
FROM "YOUR_SCHEMA"."rdp_scores" r
INNER JOIN "YOUR_SCHEMA"."rdp_env_gov" eg
ON r.statementdetails.organizationid = eg.statementdetails.organizationid
AND r.statementdetails.financialperiodenddate = eg.statementdetails.financialperiodenddate
INNER JOIN "YOUR_SCHEMA"."rdp_social" s
ON r.statementdetails.organizationid = s.statementdetails.organizationid
AND r.statementdetails.financialperiodenddate = s.statementdetails.financialperiodenddate
;
For my initial phase of research, I put in a crude 1-year lag from the ESG data’s PeriodEndDate to when I could use it in my algorithm and backtests. This was overly conservative, but easy. In reality, companies often report their ESG metrics sooner than 1-year. And, of course, there are restatements with more recent data that I’m missing in the earlier non-PiT version of ESG. But I still found some quantitative value in the ESG factors I ultimately chose, which suggests the power of their persistent influence, even when lagged longer they are in production.
The 1-year lag came into play as I daily-ized the ESG data in a time series to combine with my other content sets. While the original ESG RDP Bulk only has ESG data once a year for a given company, my own quant research is centered around a daily signal. The original StarMine Smart Holdings model, which came out over a decade ago, uses 25 traditional financial factors. Many of those factors have daily frequency. It’s worth noting that as with annual fiscal reporting, annual ESG reporting are associated with different PeriodEndDates across different companies, so on any given day you may have an influx of new ESG values to use in your daily input time series.
The write_daily_date_range_with_weekends_to_s3.ipynb is a simple Python notebook, that I ran on an AWS SageMaker Notebook server, which generates a continuous sequence of dates between a start date and an end date then writes that to S3 as a Parquet file. The following creates an Athena table from that Parquet file, with one column for the as_of_date. It is also available in the github repo as create_daily_dates_with_weekends.sql. This helper table will enable daily-izing the time series.
CREATE EXTERNAL TABLE daily_dates_with_weekends
(
as_of_date TIMESTAMP
)
ROW FORMAT SERDE 'org.apache.hadoop.hive.ql.io.parquet.serde.ParquetHiveSerDe'
STORED AS INPUTFORMAT 'org.apache.hadoop.hive.ql.io.parquet.MapredParquetInputFormat'
OUTPUTFORMAT 'org.apache.hadoop.hive.ql.io.parquet.MapredParquetOutputFormat'
LOCATION 's3://YOUR_BUCKET/data/repo/esg/daily_dates_with_weekends/'
;
The following SQL script is how I daily-ized 13 ESG factors of interest, which I later determined to add significant value when combined with the 25 traditional financial factors used in Smart Holdings. It is also available in the github repo as create_esg_factors_for_as_of_dates.sql. A lot of research into went picking those 13 factors, so my earlier attempts daily-ized even more ESG factors. Note that my query presupposes there is a daily table with your non-ESG data, which defines the companies of interest and when those companies are active in your non-ESG data. The ESG data is then daily-ized to align with the non-ESG data.
CREATE TABLE esg_factors_for_as_of_dates
WITH (format = 'Parquet', parquet_compression = 'SNAPPY', external_location ='s3:/YOUR_BUCKET/data/repo/esg/esg_factors_for_as_of_dates')
AS
-- For each AsOfDate, figure out the most recent ESG Factors
-- Assuming a 1 year lag, that means ESG factors at least 1 year prior to AsOfDate
-- But also but in a 1 year lookback prior since not all companies will report on that each 1-year lag date
WITH universe
AS
(
SELECT orgpermid,
MIN(as_of_date) AS first_date,
MAX(as_of_date) AS last_date
FROM "YOUR_SCHEMA"."TABLE_WITH_YOUR_SIGNAL_BEFORE_ESG"
GROUP BY orgpermid
),
esg_universe_dates
AS
(
SELECT u.orgpermid, d.as_of_date
FROM universe u
INNER JOIN "YOUR_SCHEMA"."daily_dates_with_weekends" d
ON d.as_of_date BETWEEN u.first_date AND u.last_date
),
most_recent_date
AS
(
SELECT d.as_of_date, d.orgpermid, MAX(e.financialperiodenddate) AS last_date
FROM esg_universe_dates d
LEFT OUTER JOIN "YOUR_SCHEMA"."rdp_esg_all_factors" e
ON d.orgpermid = CAST(e.organizationid AS BIGINT)
AND e.financialperiodenddate > DATE_ADD('year',-2, d.as_of_date)
AND e.financialperiodenddate <= DATE_ADD('year',-1, d.as_of_date)
GROUP BY d.as_of_date, d.orgpermid
)
SELECT d.as_of_date, d.orgpermid, e.totalco2equivalentsemissionstorevenues, e.vocemissionstorevenues, e.totalwastetorevenues, e.totalhazardouswastetorevenues, e.waterpollutantemissionstorevenues, e.injuriestomillionhours, e.voluntaryturnoverofemployees, e.totalrenewableenergytoenergyuse, e.womenmanagers, e.averagetraininghours, e.customersatisfaction, e.esgmanagementscore, e.esgshareholdersscore
FROM most_recent_date d
LEFT OUTER JOIN "YOUR_SCHEMA"."rdp_esg_all_factors" e
ON d.orgpermid = CAST(e.organizationid AS BIGINT)
AND e.financialperiodenddate = d.last_date
Towards of the end of 2021, ESG PiT was released, also available over RDP Bulk. With the majority of my research for ESG Smart Holdings completed by year end, I was very curious to give the new point-in-time content set a try in 2022. My hope was that my model performance would be better because I’d be using the most recently available data on an as-was basis, as it would have become available to consumers of the live RDP feed.
As an illustration of the importance of point-in-time, let’s consider CO2 Equivalents Emissions, which is probably one of the most used sustainable financial factors today. Pfizer reported 2,005,730 CO2 emissions on 8/27/2021 date, about 9 months after their PeriodEndDate (not a year after). However, later on 10/1/2021, they restated their CO2 emissions to be 1,350,000. This as-was history of how their CO2 changed is crucially important to capture, as it will affect the relative attractiveness of the stock to Smart Money investors that care about CO2 emissions.
organizationid |
financialperiodid |
periodenddate |
periodtype |
year |
ispartial |
itemcode |
esgvalue |
currency |
esgstringvalue |
changetype |
effectivefromdate |
effectivetodate |
4295904722 |
690 |
12/31/2020 |
Year |
2020 |
FALSE |
CO2EquivalentsEmissionTotal |
|
|
N |
8/27/2021 |
10/1/2021 |
|
4295904722 |
690 |
12/31/2020 |
Year |
2020 |
FALSE |
CO2EquivalentsEmissionTotal |
1350000 |
|
|
C |
10/1/2021 |
|
Whereas without PiT, you only see the most recently restated value.
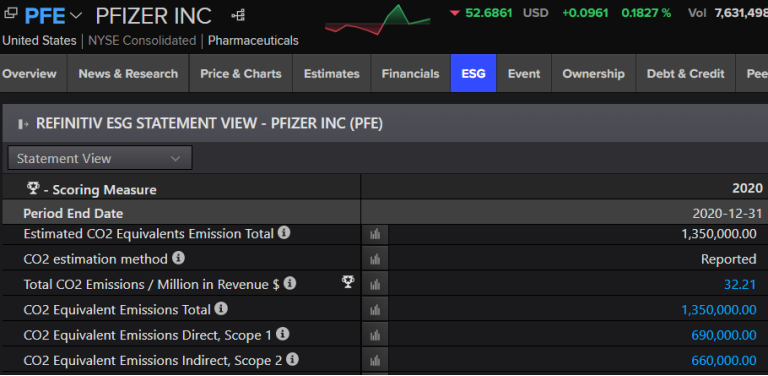
Similarly, the Total CO2 Emissions / Revenue analytic also adjusts after the change to CO2.
organizationid |
financialperiodid |
periodenddate |
periodtype |
year |
itemcode |
esganalyticvalue |
currency |
effectivefromdate |
effectivetodate |
4295904722 |
690 |
12/31/2020 |
Year |
2020 |
TotalCO2EquivalentsEmissionsToRevenues |
47.8603 |
|
9/12/2021 |
10/3/2021 |
4295904722 |
690 |
12/31/2020 |
Year |
2020 |
TotalCO2EquivalentsEmissionsToRevenues |
32.21341987 |
|
10/3/2021 |
|
The ETL process for ESG PiT was very similar to original ESG content, since it used the same RDP Bulk delivery mechanism. The only difference in the download step is that there were more than 100 files involved in the full history, so I had to use the skipToken parameter to cycle through all the files. See this article for more details.
After unzipping the files, I found they were slightly different as well. They were in CSV format rather JSON. And there was one file per company. But the process of uploading the files to S3, using an AWS Glue Crawler to define the schema and querying via Athena was the same. One thing to note is that the CSV values which contain commas are enclosed by double quotes. The OpenCSVSerde is good option to use for that Athena schema.
The following is an Athena table definition for EsgPITValueScores*.csv files. And as the name would suggest, it covers all the higher level scores (e.g. ESG Score, Governance Pillar Score, Management Category Score). It is also available as create_esgpitscores_csv.sql in the accompanying github repo.
CREATE EXTERNAL TABLE esgpitscores_csv
(
organizationid BIGINT,
financialperiodid BIGINT,
periodenddate STRING,
periodtype STRING,
year BIGINT,
itemcode STRING,
esganalyticvaluescore DOUBLE,
esganalyticvaluescoregrade STRING,
effectivefromdate STRING,
effectivetodate STRING
)
ROW FORMAT SERDE 'org.apache.hadoop.hive.serde2.OpenCSVSerde'
WITH SERDEPROPERTIES
(
'separatorChar' = ',',
'quoteChar' = '"'
)
LOCATION 's3://YOUR_BUCKET/data/repo/esg_pit/EsgPITScores/'
TBLPROPERTIES ('skip.header.line.count'='1')
The following is an Athena table definition for the EsgPITValues*.csv files. It’s the as-reported ESG data disclosed by companies (e.g. CO2EquivalentsEmissionTotal). The source file create_esgpitvalues_csv.sql can be found in the accompanying github repo.
CREATE EXTERNAL TABLE esgpitvalues_csv
(
organizationid BIGINT,
financialperiodid BIGINT,
periodenddate STRING,
periodtype STRING,
year BIGINT,
ispartial BOOLEAN,
itemcode STRING,
esgvalue STRING,
currency STRING,
esgstringvalue STRING,
changetype STRING,
entrydate STRING,
effectivetodate STRING
)
ROW FORMAT SERDE 'org.apache.hadoop.hive.serde2.OpenCSVSerde'
WITH SERDEPROPERTIES
(
'separatorChar' = ',',
'quoteChar' = '"'
)
LOCATION 's3://YOUR_BUCKET/data/repo/esg_pit/EsgPITValues/'
TBLPROPERTIES ("skip.header.line.count"="1")
;
Finally, the following is the Athena table definition for the EsgPITAnalyticValue*.csv files. These are Refinitiv calculated analytics, using the company reported ESG data with perhaps other Refinitiv content sets (e.g. TotalCO2EquivalentsEmissionsToRevenues). The source file create_esgpitanalyticvalue_csv.sql is available in the accompanying github repo.
CREATE EXTERNAL TABLE esgpitanalyticvalue_csv
(
organizationid BIGINT,
financialperiodid BIGINT,
periodenddate STRING,
periodtype STRING,
year BIGINT,
itemcode STRING,
esganalyticvalue DOUBLE,
currency STRING,
effectivefromdate STRING,
effectivetodate STRING
)
ROW FORMAT SERDE 'org.apache.hadoop.hive.serde2.OpenCSVSerde'
WITH SERDEPROPERTIES
(
'separatorChar' = ',',
'quoteChar' = '"'
)
LOCATION 's3://204384-starmine-research/data/repo/esg_pit/EsgPITAnalyticValue/'
TBLPROPERTIES ('skip.header.line.count'='1')
;
There was some cleansing of the data that I found helpful: (1) replacing the text “null” with an actual NULL value, (2) strongly typing date and numerical fields and (3) falling back to my 1-year lag logic when appropriate and (4) using my preferred file format of Parquet which works well with Athena or just loading the data directly into Python code.
It’s worth noting that the ESG PiT history doesn’t go back as far as we have ESG data. It varies per different type of ESG data but the general behavior is that the effective date for older data will be set to when PiT data started being collected. So for some older data, there can be quite a large gap from the PeriodEndDate. Hence, my fallback logic to use the 1-year lag for when PiT data was not available. See the "Point in time history available from" on Page 5 of the user guide for more details.
The create_esgpitscores_fixed.ipynb, create_esgpitvalues_fixed.ipynb and create_esgpitanalyticvalue_fixed.ipynb notebooks (available in the accompanying github repo) show how I transformed the CSV-based schema into Parquet format with the transformation discussed above.
As mentioned earlier, my existing quant model code expects ESG data to be in a condensed tabular format. For every date and company, I need to know what the most recent values were available for each of the 13 ESG factors I’m focusing on. There are two transformations that have to happen here. The first is that I need to go from the efficient normalized key/value structure to a less database efficient (but still useful) denormalized format where I have a column for every ESG factor I’m studying. The second part of the transformation is finding the most recent data point for each date. My approach to do this is that for each company/date, find the most recently reported period. And for that company/date/period, find the most recent EffectiveFromDate. I am not using EffectiveToDate intentionally since I don’t need to. When a new value replaces the old, it will have a more recent EffectiveFromDate.
The Most_Recent_ESG_Per_As_Of_Date_KeyValue.ipynb notebook pulls the 13 ESG factors of interest from those three tables created earlier. The Most_Recent_ESG_Per_As_Of_Date_Flat.ipynb notebook flattens those 13 ESG factors into a daily-ized tabular format where there is one row per company/data with columns for each of the factors. Similar to the non-PIT ESG example earlier, there’s an assumption that you also have a table with your non-ESG data, so you’re only pulling in ESG for the companies in your study universe.
After integrating the new ESG PiT data, replacing the regular ESG data, I ran the rest of my model code. I can’t get into the details because it is proprietary, but know that the distributed cloud processing gets quite intense! For example, at one step I’m working with 4.5TB of data as each owner preference profile votes on each stock for each date in my daily 10 years of study history. Whenever Athena or single server Python couldn’t handle my processing, I found AWS Glue (via Spark SQL) scaled quite well. Since I relied so heavily on the AWS ecosystem for my modeling, it was quite beneficial to start from a place where the Refinitiv ESG PiT data was easily accessible in S3 with an Athena schema.
The ESG Smart Holdings model run with the ESG PiT data from RDP caused my Spread Return to improve as did my Information Coefficient and Standard Deviation of Information Coefficient! This helps to speak to the value of using timelier updated ESG data, compared to my prior approach of manually lagging every data point by a year and not considering restatements. The use of point-in-time data, which so many quants value, also makes me confident that my research code will better model the real world ESG data conditions that will exist when this ESG Smart Holdings model goes live. If you’re already using point-in-time data for financials and estimates, it’s only prudent to similarly use point-in-time ESG data in your backtests.
Source Code