
When investing in a retirement fund using DCA(Dollar-Cost Averaging) strategy, does it perform better than the inflation rate?
In this Article, we will find out what is the past inflation rate in Thailand.
Then we will find out how the DCA on a fund performs.
And then we will plot a bar chart to compare the average return against inflation.
Step 1: Import Eikon Data APIs and libraries
#Import Python library
import pandas as pd
import eikon as ek
#Set app key and set display properties
ek.set_app_key('__YOUR_API_APP_KEY__')
pd.set_option('display.max_rows', 14)
pd.options.display.float_format = '{:,.2f}'.format
Step 2: Find out the inflation rate
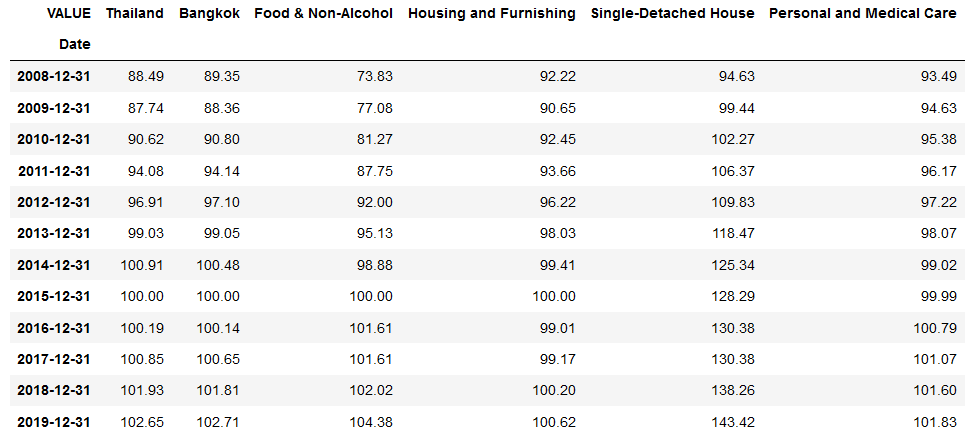
#Overview on Thailand Consumer Price Index in the past 10+ years
CPIs_RIC = ['aTHCPI', #Thailand Consumer Price Index
'aTHCPIBK', #Thailand Bangkok Price Index
'aTHCPIFB', #Food and Non-Alcohol Price Index
'aTHCPIHOSF/C', #Housing and Furnishing Price Index
'aTHHPSDHHE/C', #Single House Price Index
'aTHCPIPMCF/C'] #Personal and Medical Care Price Index
CPIs = ek.get_timeseries(CPIs_RIC,interval='yearly',start_date='2008-01-01',end_date='2020-03-03')
CPIs = CPIs.rename(columns={'aTHCPI': 'Thailand',
'aTHCPIBK': 'Bangkok',
'aTHCPIFB': 'Food & Non-Alcohol',
'aTHCPIHOSF/C': 'Housing and Furnishing',
'aTHHPSDHHE/C': 'Single-Detached House',
'aTHCPIPMCF/C':'Personal and Medical Care'})
CPIs
These are the price indexes.
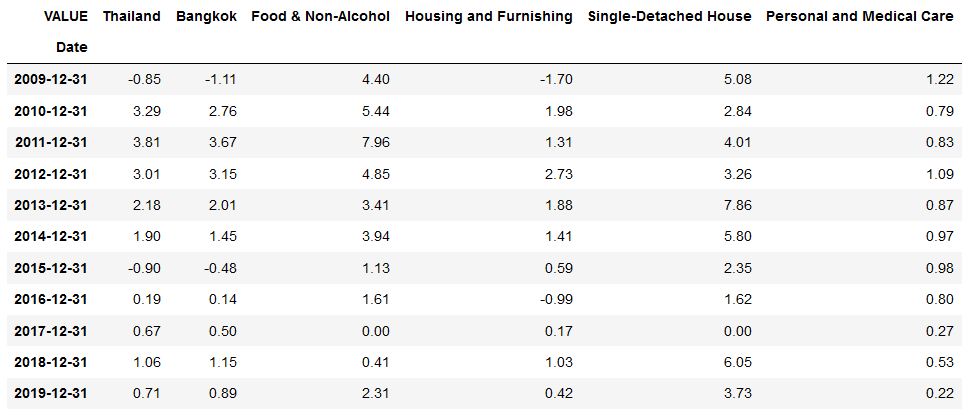
Convert it to percent changes per year.
#Show percent change compare to previous year
#This is actually the inflation
CPIs = CPIs.pct_change()*100
CPIs.dropna(inplace=True)
CPIs
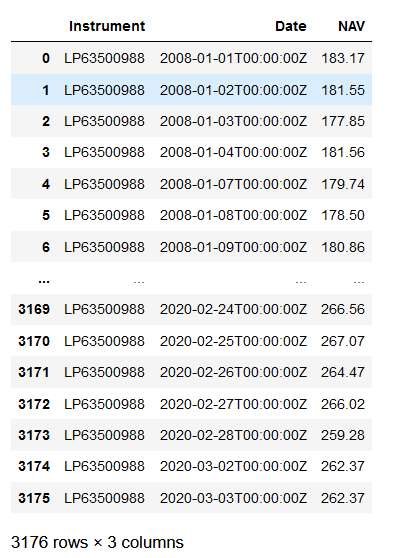
Step 3: Retrieve Fund NAV for the past years
#Get Fund NAV from RIC
FundRIC = 'LP63500988'
df1, e = ek.get_data(FundRIC,['TR.FundNAV.date','TR.FundNAV'],{'SDate':'2008-01-01','EDate':'2020-03-03'})
df1
Step 4: Define your past contribution.
Please note that these are sample numbers which include random increment per year.
#Define DCA contribution to your fund, please note that this is a random sample numbers
contributions = []
contributions.append([pd.Timestamp('2008-11-01'),100])
contributions.append([pd.Timestamp('2008-12-01'),100])
contributions.append([pd.Timestamp('2009-01-01'),100])
contributions.append([pd.Timestamp('2009-02-01'),100])
contributions.append([pd.Timestamp('2009-03-01'),100])
contributions.append([pd.Timestamp('2009-04-01'),100])
#...
#...monthly contributions...
#...
contributions.append([pd.Timestamp('2019-08-01'),189])
contributions.append([pd.Timestamp('2019-09-01'),189])
contributions.append([pd.Timestamp('2019-10-01'),189])
contributions.append([pd.Timestamp('2019-11-01'),189])
contributions.append([pd.Timestamp('2019-12-01'),189])
contributions.append([pd.Timestamp('2020-01-01'),189])
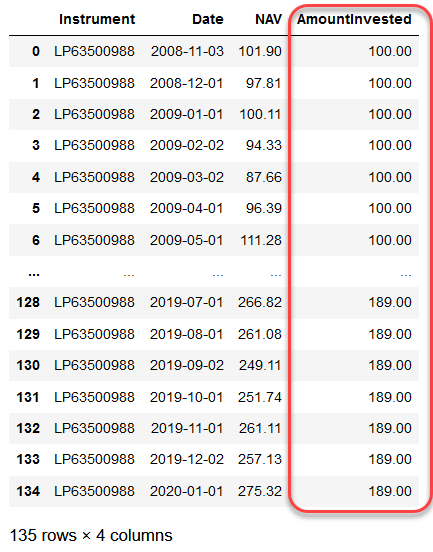
Step 5: Fill contribution data into NAV dataframe using the date.
If the date could not be found in NAV dataframe, add 1 day to the date (until the NAV is found).
Then remove all the rows without a contribution
#Add Amount Invested column and set its value to 0
df1['AmountInvested'] = 0.0
#Convert Date column from object to datetime64
df1['Date'] = pd.to_datetime(df1['Date'], infer_datetime_format=True)
#Loop through contributions and add Amount Invested to dataframe
#If the NAV of the date contributed could not be found, add 1 day until NAV is found
for contribution in contributions:
searchingDay = contribution[0]
while (len(df1.loc[df1['Date'] == searchingDay, 'AmountInvested'])==0):
searchingDay += pd.DateOffset(1)
df1.loc[df1['Date'] == searchingDay, 'AmountInvested'] = contribution[1]
#Drop any row without contribution from dataframe
df1 = df1[df1["AmountInvested"] > 0]
df1 = df1.reset_index(drop=True)
df1
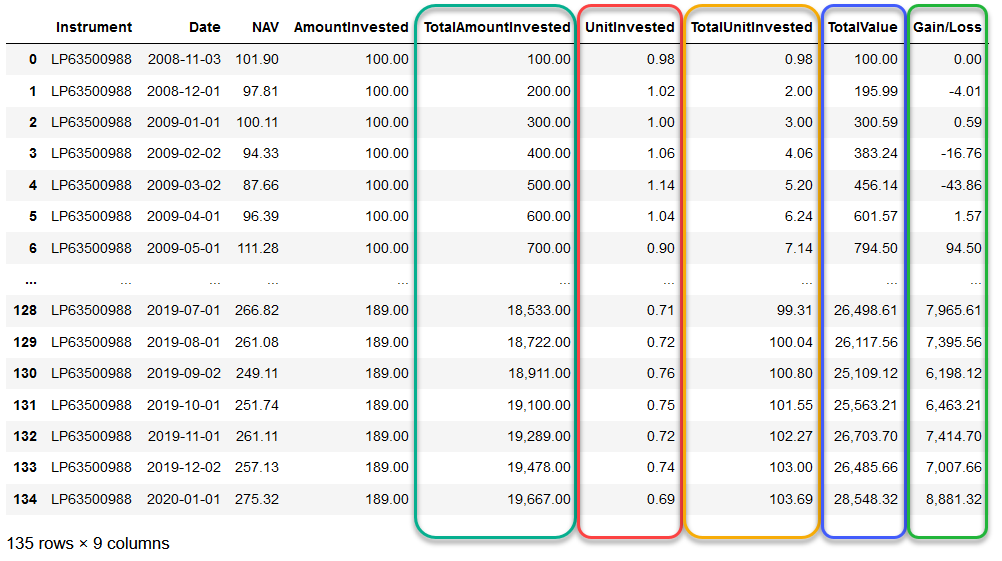
Step 6: Add calculated data to the dataframe. They are Total Amount Invested, Unit Invested, Total Unit Invested and Gain/Loss columns.
Once you complete this step, you are able to see how much you gain(or loss).
But this still does not give you the idea of how much it grows per year on average.
#Add Total Amount Invested column and set its value to cumulative summation of Amount Invested
df1['TotalAmountInvested'] = df1['AmountInvested'].cumsum()
#Add Unit Invested column and set its value to Amount Invested / NAV
df1['UnitInvested'] = df1['AmountInvested']/df1['NAV']
#Add Total Unit Invested column and set its value to cumulative summation of Unit Invested
df1['TotalUnitInvested'] = df1['UnitInvested'].cumsum()
#Add Total Value column and set its value to Total Unit Invested * NAV
df1['TotalValue'] = df1['NAV']*df1['TotalUnitInvested']
#Add Absolute Gain or Loss and set its value to Total Value - Total Amount Invested
df1['Gain/Loss'] = df1['TotalValue']-df1['TotalAmountInvested']
df1
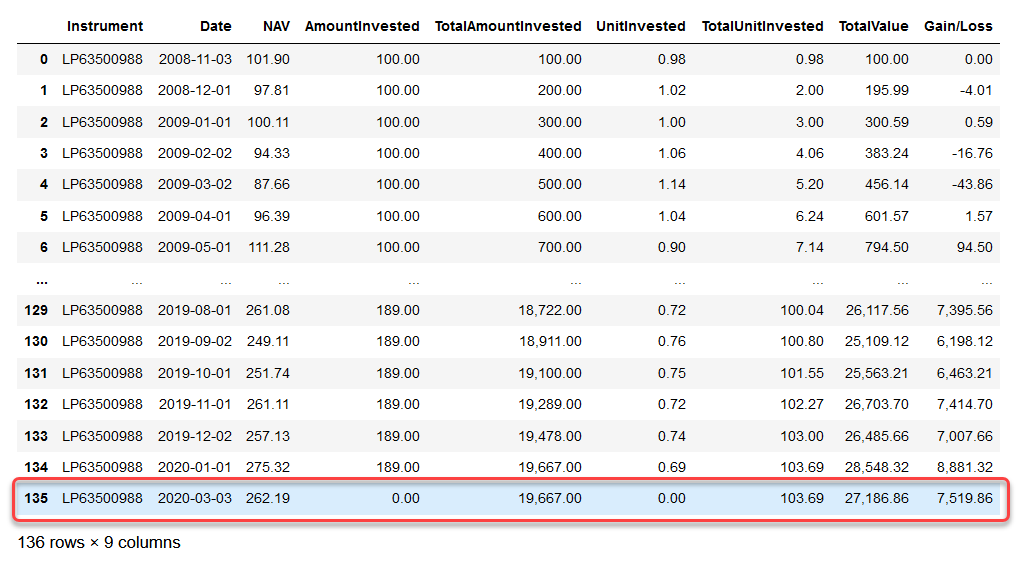
Step 7: Get current NAV
#Get current NAV and calculate Total Unit Invested, Total Value and Absolute Gain/Loss
df2, e = ek.get_data(FundRIC,['TR.FundNAV.date','TR.FundNAV'])
df2['Date'] = pd.to_datetime(df2['Date'], infer_datetime_format=True)
df2["AmountInvested"] = 0
df2["TotalAmountInvested"] = df1.tail(1)["TotalAmountInvested"].values[0]
df2["UnitInvested"] = 0
df2["TotalUnitInvested"] = df1.tail(1)["TotalUnitInvested"].values[0]
df2['TotalValue'] = df2['NAV']*df2['TotalUnitInvested']
df2['Gain/Loss'] = df2['TotalValue']-df2['TotalAmountInvested']
df2

Append it to the previous dataframe
#Append df2 to df1
df1 = df1.append(df2, ignore_index = True)
df1
Step 8: Define xirr() function
XIRR is the internal rate of return for a schedule of cash flows that is not necessarily periodic.
#Define xirr function
#https://stackoverflow.com/questions/8919718/financial-python-library-that-has-xirr-and-xnpv-function
def xirr(transactions):
years = [(ta[0] - transactions[0][0]).days / 365.0 for ta in transactions]
residual = 1
step = 0.05
guess = 0.05
epsilon = 0.0001
limit = 10000
while abs(residual) > epsilon and limit > 0:
limit -= 1
residual = 0.0
for i, ta in enumerate(transactions):
residual += ta[1] / pow(guess, years[i])
if abs(residual) > epsilon:
if residual > 0:
guess += step
else:
guess -= step
step /= 2.0
return guess-1
Step 9: Prepare data from dataframe for xirr function
#Extract data from Dataframe and prepare it for xirr function
#For xirr function, invested money is negative
df1['AmountInvested'] = df1['AmountInvested']*-1
#Get Date and amount
tas = df1[['Date','AmountInvested']].values.tolist()
#The current date(last row) value is a positive number and it is the Total Value
tas[-1][1] = df1.tail(1)["TotalValue"].values[0]
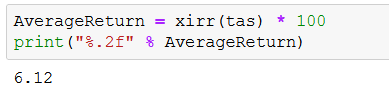
Calculate xirr
AverageReturn = xirr(tas) * 100
print("%.2f" % AverageReturn)
Step 10: Compare between Inflation and Average Return
First, let add "Return" to the CPIs dataframe
CPIs['Return'] = AverageReturn
CPIs
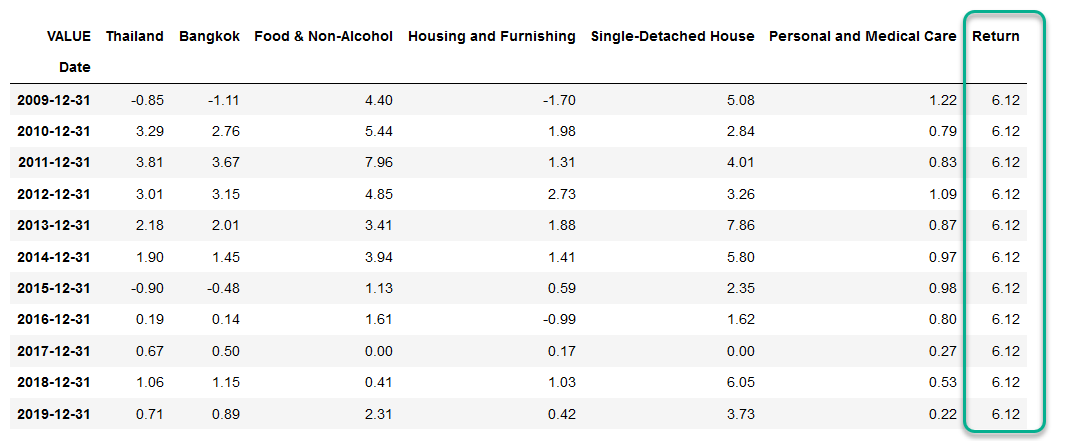
Next, plot bar chart to compare the inflation rates and average return
#Plot Bar Chart to compare inflation and average return
CPIs.plot.bar(figsize=(15,12))
Here is the chart:
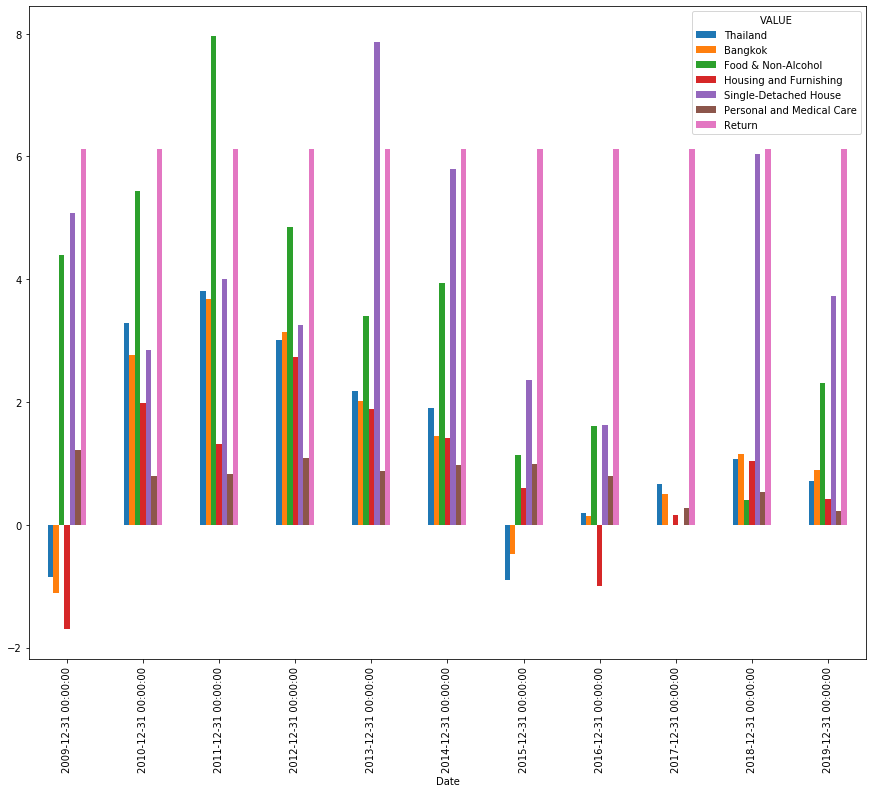
You can see from the bar chart that the average return from the sample DCA investing on "LP63500988" fund usually wins against inflation.
Except in 2011(against Food) and 2013(against House).
You can try running this Jupyter Notebook sample using your own contribution data and use the actual fund you are DCA investing in.
Reference:
SOURCE CODE