
About this article
This article is intended for Java software users who are developing RFA Java Consumer applications. It is going to explain how to verify, if the application is out of memory, due to slow processing data events/messages and the ways to solve the problem.
Overview
An application can make a data request by creating an Interest Specification which contains the data request information (e.g., the item name, the model type, the service name) and send it to RFA. It is then placed into RFA’s queue and RFA will send it to the server. Next, the server will process the request and send the data back to RFA i.e. a Refresh followed by Updates until the application cancels the request. A new event (data) is passed to the application and is placed in the application’s event queue. The application can retrieve an event from the event queue by calling dispatch() method periodically or on a notification as the figure shown below:
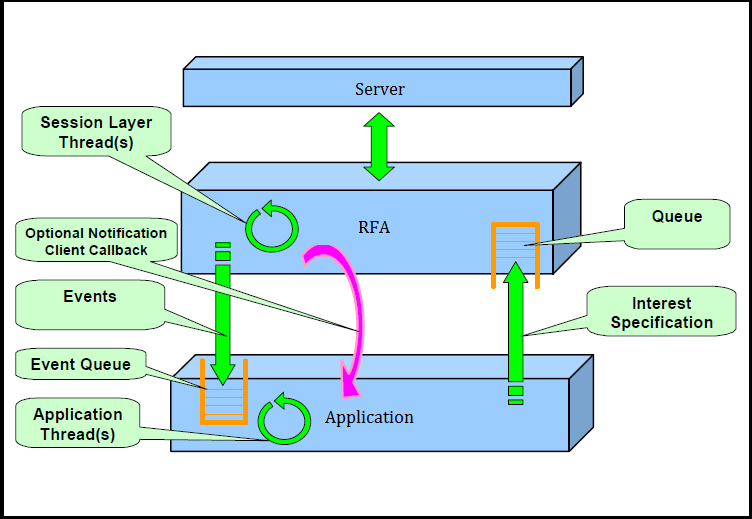
The processEvent(..) method which is implemented by the application is then called to process the event. Finally, the application code handles data in the event as required e.g. displaying in a GUI, storing the data in a database, processing for algorithmic trading and so on. An Out of memory issue can occur if processEvent(..) spends too much time processing each event, resulting in a gradual increase in pending events (in the queue) and thereby consuming a huge amount of memory in the queue.
Problem
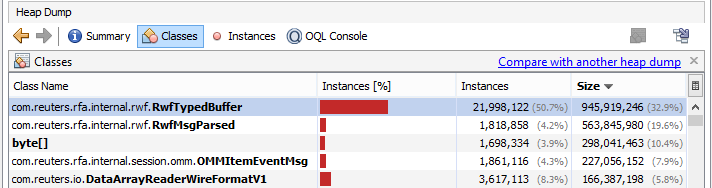
The users can experience out of memory when the application does not process the incoming events fast enough; leading to an ever increasing number of events which have not yet been processed by the application pending in the event queue. As a result, the memory usage grows until the application runs out of memory. The users can verify if the out of memory issue is due to a lot of pending events in the event queue by observing a heap dump file when the problem occurs. Java VisualVM(jvisualvm.exe) which ships with JDK can be used to take a heap dump. When browsing the heap dump file, it will show OMMItemEventMsg instances and their internal instances i.e. RwfTypedBuffer, RwfMsgParsed as the top classes using up the most memory as per the example below:
In the event queue instance (EventQueueImpl), you will see a lot of pending events shown in _count of EventQueueImpl instance which could reach a million (or higher) as in the example shown below:
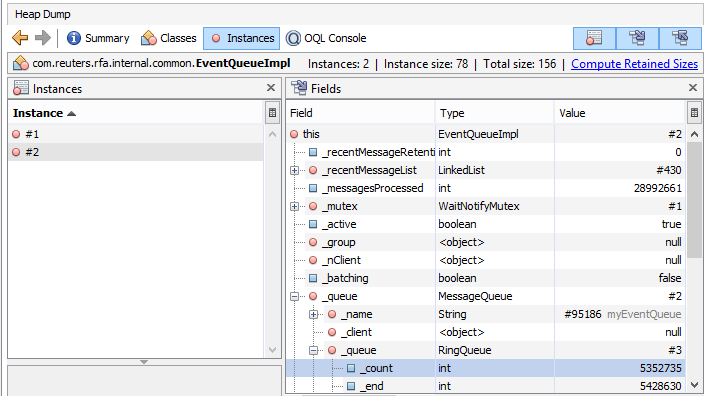
If you take a heap dump periodically, you will see that _count of EventQueueImpl increases as per the number of pending events in the event queue.
Solution
To solve the problem, we have to change the implementation of the application so that it can process the events in a more timely manner and thereby keep the number of pending events in the event queue low. The lower the number of events in the event queue, the lower the memory usage will be. The suggested solutions are:
- Minimize the time spent Processing incoming data in the callback method processEvent(..). Avoid making database and/or other blocking calls in the method. The application could use an additional thread to process the received event separately. Therefore, minimum time is spent in processEvent(..) and other events in the event queue are picked up to be processed in a more timely manner. The example source code:
public void processEvent(Event event)
{
if (event.getType() == Event.OMM_ITEM_EVENT)
{
OMMItemEvent ie = (OMMItemEvent)event;
OMMMsg respMsg = ie.getMsg();
//WorkerThread implements Runnable to process data in run()
//it accepts OMMMsg(data) and OMMPool used to acquire/release OMMMsg
Runnable worker = new WorkerThread(respMsg,_mainApp.getPool());
// _executor is an ExecutorService instance which mananges a pool of threads
//.execute(..) calls WorkerThread.run() to process data by a separated thread
_executor.execute(worker);
}
}
class WorkerThread implements Runnable
{
private OMMMsg datamsg;
private OMMPool pool;
public WorkerThread(OMMMsg msg,OMMPool p)
{
pool = p;
datamsg = pool.acquireMsg();
//copy(keep) data which will be processed later
datamsg.initFrom(msg);
}
public void run() {
//process data which is in OMMMsg instance(datamsg) accord to business logic
...
//release OMMMsg which data has been processed already
pool.releaseMsg(datamsg);
}
}
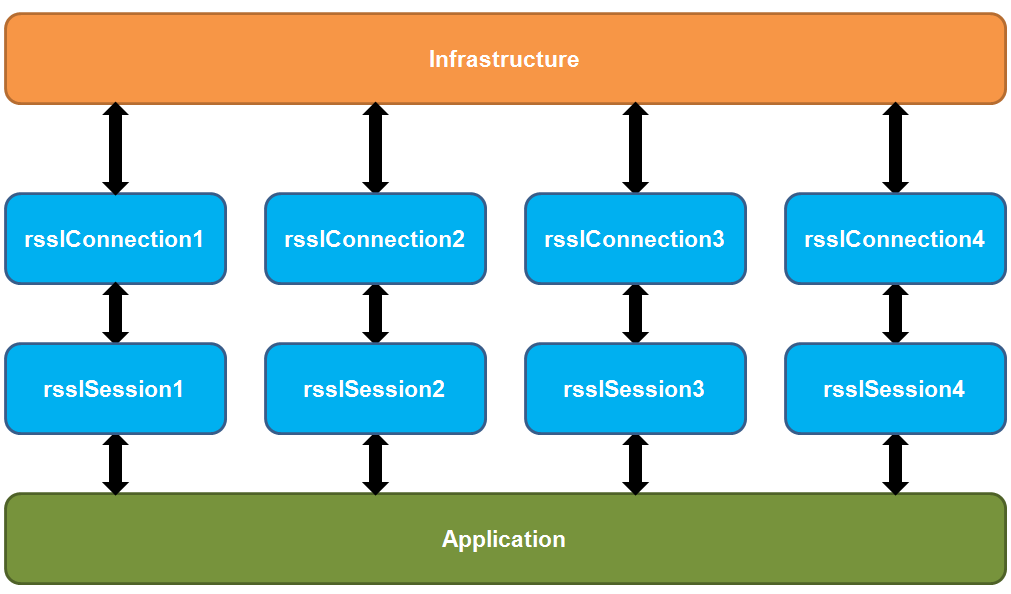
2. Implement Horizontal Scaling. This solution can be used for a machine having multiprocessor cores. It should be used when the solution 1) minimize time spent in the callback method does not solve the problem. That means 1 thread/1 event queue is not fast enough to process the quantity of events being received. Multiple threads/event queues as per the Horizontal Scaling concept are required. Horizontal Scaling can be used to further distribute the processing of events between multiple CPU cores while running a single process on the machine. Below is the example design of the application applied horizontal scaling with 4 sessions/connections:
The connections/sessions node in RFA configuration according to the design above should be:
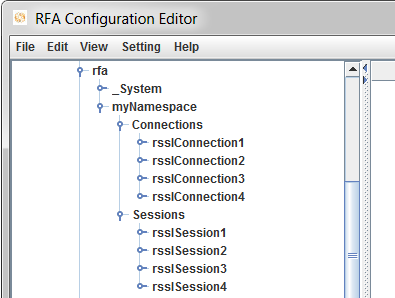
The application has 4 sessions. Each session has its own connection which connects to the same Infrastructure/server.
In this example : rsslSession1 uses rsslConnection1, rsslSession2 uses rsslConnection2, rsslSession3 uses rsslConnection3 and rsslSession4 uses rsslConnection4. rsslConnection1-4 connects to the same server. Each session has a thread to dispatch an event from its own event queue. Hence, the application has 4 threads and 4 event queues. Therefore, the application can speed up dispatching incoming events by using 4 threads which should be faster than dispatching events by a single thread when the Horizontal Scaling is not implemented.
Anyway, Horizontal Scaling requires sufficient CPU cores according to the number of sessions. Normally, an application having 1 session contains:
- One RFA session thread per a session to put the received events to the queue
- One application thread per a session to dispatch events from the queue then invoke processEvent(..). method.
- One main application thread regardless the number of sessions to keep the application running
Hence, the total number of threads for 4 sessions in the figure above are 9 threads; 2 threads/session * 4 sessions + 1 main thread. That means to implement Horizontal Scaling with 4 sessions, the machine should have more than 9 CPU Cores e.g. 10, 12, 16 CPU Cores. If your machine have 8 CPU Cores, you can implement Horizontal Scaling with the maximum 3 sessions; the total number of threads is 7 threads; 2 threads/session * 3 sessions + 1 main thread. If you implement Horizontal Scaling on insufficient CPU cores machine e.g. 4 sessions on 4 CPU Cores machine, the memory leak problem can occur because the number of pending events increases due to insufficient threads(CPU cores) to process the events.
Conclusion
Out of memory in RFA consumer application can occur when the application does not process the incoming data(events) fast enough. Therefore, a lot of memory is used to keep a huge number of events (data) which are waiting to be processed by the application. Eventually, the application runs out of memory due to high memory usage of OMMItemEventMsg instances and their internal instances i.e. RwfTypedBuffer, RwfMsgParsed. The suggested solutions are:
- Minimize the time spent Processing incoming data in the callback method, processEvent(..)
- Implement Horizontal Scaling
Reference
For further details, please check out the following resource: