Ariticle
Getting Started with Eikon Data API .NET in Jupyter Notebook
Author:

The Eikon Data API provides simple access to users who require programmatic access to Refinitiv data on the desktop. These APIs are intended for Eikon users.
The APIs provide access to the following content sets:
- Fundamental and reference data
- Price time series
- News
- Symbology conversion
This article will explain how to install and use the .NET library for Eikon Data API in Jupyter Notebook.
Note: This library is open-source, community-owned, and not officially supported by Refinitiv.
Prerequisite
- To run examples in this article, please refer to this Using .NET Core in Jupyter Notebook article for setting up Jupyter Notebook to support the .NET programming languages
- The Refinitiv Eikon or Workspace must be run properly on the machine
- The application key is required to connect to Eikon or Workspace. To generate the application, please refer to the Eikon Data API Quick Start Guide.
Install the packages
The Eikon Data API package is available in Nuget so the dotnet-interactive #r magic command can be used to install the package from NuGet.
Run the below commands to install Eikon Data API and Microsoft.Data.Analysis (0.4.0) packages.
#r "nuget:EikonDataAPI"
#r "nuget:Microsoft.Data.Analysis,0.4.0"
Refer the namespaces
This article uses classes from the following four packages. Therefore, it uses the using statement to refer to those packages.
- EikonDataAPI: .NET library for Eikon Data API
- XPlot.Plotly: A cross-platform data visualization package for the F# and .NET programming languages
- Microsoft.Data.Analysis: An easy-to-use and high-performance libraries for data analysis and transformation
- Microsoft.AspNetCore.Html: Types for manipulating HTML content
using EikonDataAPI;
using XPlot.Plotly;
using Microsoft.Data.Analysis;
using Microsoft.AspNetCore.Html;
This can be overridden by registering the custom formatter for the DataFrame. The below code registers custom formatters for the Dataframe and DataFrameRow to render the data in an HTML table.
It only displays the first 100 rows. This can be changed by modifying the value of the take variable.
Formatter<DataFrame>.Register((df, writer) =>
{
var headers = new List<IHtmlContent>();
headers.Add(th(i("index")));
headers.AddRange(df.Columns.Select(c => (IHtmlContent) th(c.Name)));
var rows = new List<List<IHtmlContent>>();
var take = 100;
for (var i = 0; i < Math.Min(take, df.Rows.Count); i++)
{
var cells = new List<IHtmlContent>();
cells.Add(td(i));
foreach (var obj in df.Rows[i])
{
cells.Add(td(obj));
}
rows.Add(cells);
}
var t = table(
thead(
headers),
tbody(
rows.Select(
r => tr(r))));
writer.Write(t);
writer.Write(df.Rows.Count + " x "+df.Columns.Count);
}, "text/html");
Formatter<DataFrameRow>.Register((dataFrameRow, writer) =>
{
var cells = new List<IHtmlContent>();
cells.Add(td(i));
foreach (var obj in dataFrameRow)
{
cells.Add(td(obj));
}
var t = table(
tbody(
cells));
writer.Write(t);
}, "text/html");
Create Eikon Interface
After installing EikonDataAPI, the application can use the API by calling the Eikon.CreateDataAPI() static method to create an Eikon interface. This interface is an access point to all functionalities in Eikon Data APIs.
Then, the first method that must be called with the Eikon interface is Eikon.SetAppKey(). This method accepts one string argument that represents the application ID. The application ID identifies your application on the Refinitiv Platform. You can get an application ID using the Application ID generator. For more information, please refer to the QuickStart guide.
IEikon eikon = Eikon.CreateDataAPI();
eikon.SetAppKey("<Application Key>");
Fundamental and reference data
The GetData() methods can be used to retrieve fundamental and reference data. These methods have three parameters.
| Name | Type | Description |
|---|---|---|
| instrument(s) | string, or list of string | Required: Single instrument or list of instruments to request. |
| fields | string, list of string, or list of TRField | Required: A single field as a string, such as 'TR.PriceClose' A list of fields, such as A list of TRFields, such as |
| parameters | dictionary | Optional: Dictionary of global parameters to request, such as new Dictionary { { "SDate", "2017-10-23"},{"EDate","2017-11-29" },{"Frq","D"},{"CH","Fd" },{"RH","IN" } }
|
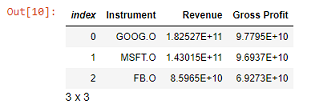
The following code retrieves fundamental data - Revenue and Gross Profit - for Google, Microsoft, and Facebook.
List<string> instruments = new List<string> {
"GOOG.O",
"MSFT.O",
"FB.O"
};
List<string> fields = new List<string> {
"TR.Revenue",
"TR.GrossProfit"
};
var data = eikon.GetData(
instruments,
fields
);
data
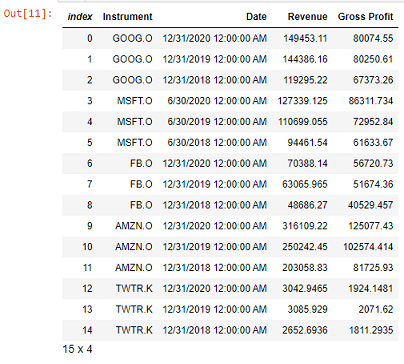
The additional parameters can be specified to request full year revenue and gross profit for the last 2 years scaled to millions and converted to Euros.
List<string> instruments = new List<string> {
"GOOG.O",
"MSFT.O",
"FB.O",
"AMZN.O",
"TWTR.K"
};
List<string> fields = new List<string> {
"TR.Revenue.date",
"TR.Revenue",
"TR.GrossProfit"
};
Dictionary<string, string> parameters = new Dictionary<string, string> {
{ "Scale", "6" },
{ "SDate", "0" },
{ "EDate","-2"},
{ "FRQ","FY" },
{ "Curn","EUR" }
};
var data = eikon.GetData(
instruments,
fields,
parameters
);
data
Time Series Data
The GetTimeSeries() methods can be used to retrieve historical data on one or several RICs. These methods have eight parameters.
| Name | Type | Description |
|---|---|---|
| ric(s) | string or list of strings | Required: Single RIC or List of RICs to retrieve historical data for |
| startDate | string or DateTime | Required: Starting date and time of the historical range. String format is "yyyy-MM-dd", "yyyy-MM-ddTHH:mm:ss", "yyyy-MM-ddTHH:mm:sszzz", or "yyyy-MM-ddTHH:mm:ssZ" |
| endDate | string or DateTime | Required: End date and time of the historical range. String format is "yyyy-MM-dd", "yyyy-MM-ddTHH:mm:ss", "yyyy-MM-ddTHH:mm:sszzz", or "yyyy-MM-ddTHH:mm:ssZ" |
| interval | Interval enumeration | Optional: Data interval. Possible values: tick, minute, hour, daily, weekly, monthly, quarterly, yearly (Default: daily) |
| fields | List of TimeSeriesField enumerations | Optional: Use this parameter to filter the returned fields set. Available fields: TIMESTAMP, VALUE, VOLUME, HIGH, LOW, OPEN, CLOSE, COUNT. By default, all fields are returned |
| count | integer | Optional: Max number of data points retrieved |
| calendar | Calendar enumeration | Optional: Possible values: native, tradingdays, calendardays |
| Corax | Corax enumeration | Optional: Possible values: adjusted, unadjusted |
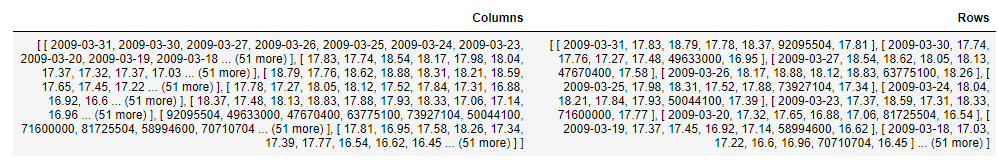
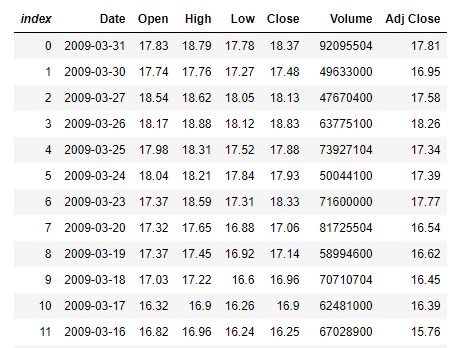
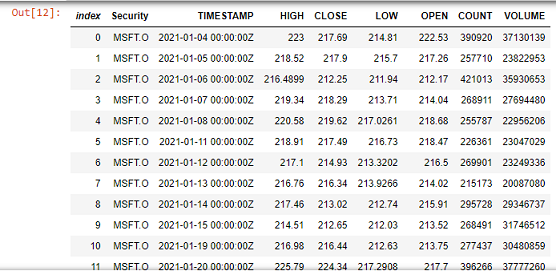
The following code returns time series of daily price history for Microsoft Corp ordinary share between 1st of Jan and 10th of April 2021.
var historicalData = eikon.GetTimeSeries(
"MSFT.O", //a single RIC to retrieve historical data for
new DateTime(2021, 1, 1), //starting date of the historical range
new DateTime(2021, 4, 10) //end date of the historical range
);
historicalData
News Headlines and Stories
The GetNewsHeadlines() methods can be used to get a list of news headlines. These methods have four parameters.
| Name | Type | Description |
|---|---|---|
| query | string | Optional: News headlines search criteria. The text can contain RIC codes, company names, country names and operators (AND, OR, NOT, IN, parentheses and quotes for explicit search…). (Default: Top News written in English) |
| count | integer | Optional: Max number of headlines retrieved. Value Range: [1-100]. (Default: 10) |
| dateFrom | string or DateTime | Optional: Beginning of date range. String format is "yyyy-MM-dd", "yyyy-MM-ddTHH:mm:ss", "yyyy-MM-ddTHH:mm:sszzz", or "yyyy-MM-ddTHH:mm:ssZ" |
| dateTo | string or DateTime | Optional: End of date range. String format is "yyyy-MM-dd", "yyyy-MM-ddTHH:mm:ss", "yyyy-MM-ddTHH:mm:sszzz", or "yyyy-MM-ddTHH:mm:ssZ" |
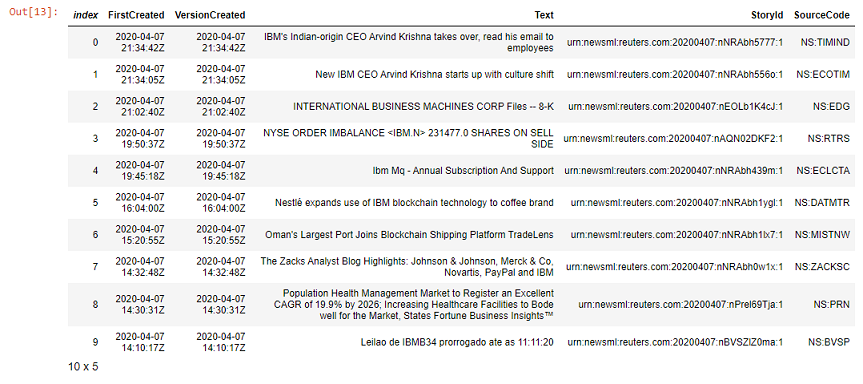
The following code retrieves news headlines of International Business Machines Corp (an equity RIC: IBM.N), between 00:00 and 23:59 GMT on the 7th of Apr 2020.
var headlines = eikon.GetNewsHeadlines(
"R:IBM.N", //Retrieve news headlines related to LHAG.DE
null, //count parameter is null so it will use the default value which is 10
"2020-04-07T00:00:00Z", //Beginning of date range
"2020-04-07T23:59:59Z" //End of date range
);
headlines
Then, the GetNewsStory() method can be used to retrieve a single news story corresponding to the identifier provided in StoryId. This method has one parameter.
| Name | Type | Description |
|---|---|---|
| storyId | string | Required: The story Id of the news story |
This method returns a string of story text.
The following code retrieves the news story of the first retrieved news headline.
string storyId = headlines.Columns["StoryId"][0].ToString(); //Get the StoryId of the first headline
display(HTML(eikon.GetNewsStory(storyId)))

Symbology conversion
The GetSymbology() methods can be used to get a list of instrument names converted into another instrument code, such as converting SEDOL instrument names to RIC names. These methods have four parameters.
| Name | Type | Description |
|---|---|---|
| symbol(s) | string or list of strings | Required:Single instrument or list of instruments to convert |
| fromSymbolType | SymbologyType enumeration | Optional: Instrument code to convert from. Possible values: RIC,ISIN,CUSIP,SEDOL,ticker,lipperID,OAPermID,or IMO (Default: RIC) |
| toSymbolType | List of SymbologyType enumeration | Optional: List of instrument code to convert to. Possible values: RIC,ISIN,CUSIP,SEDOL,ticker,lipperID,OAPermID,or IMO |
| bestMatch | boolean | Optional:Defines whether "bestMatch" section only is required. (Default: true) |
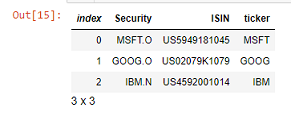
The following code converts RICs to ISINs and tickers and returns only best match.
List<string> instruments = new List<string> {
"MSFT.O",
"GOOG.O",
"IBM.N"
};
List<SymbologyType> toSymbolType = new List<SymbologyType> {
SymbologyType.ticker,
SymbologyType.ISIN
};
var responseSymbol = eikon.GetSymbology(
instruments,
SymbologyType.RIC,
toSymbolType
);
responseSymbol
Plot charts by using XPlot.Ploty
XPlot.Ploty is a cross-platform data visualization package for the F# and .NET programming languages. It is based on Plotly which is the popular JavaScript charting library.
The following examples demonstrate how to use XPlot.Ploty to plot charts from historical data retrieved by Eikon Data API.
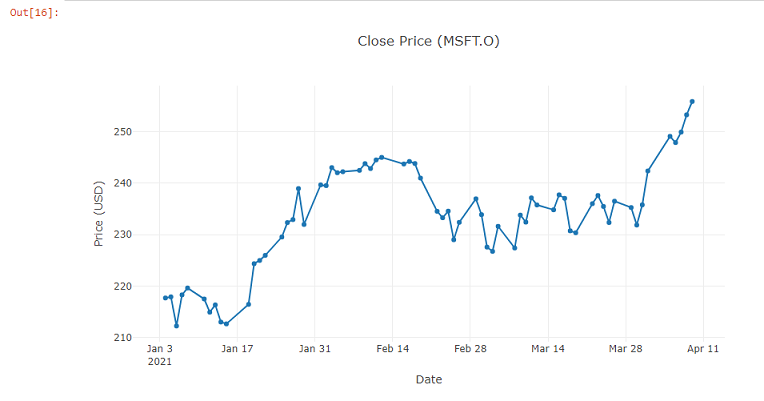
Line chart
The following code plots a line chart from the CLOSE column in the DataFrame retrieved from the GetTimeSeries() method.
var chart1 = Chart.Plot(
new Graph.Scatter
{
x = historicalData.Columns["TIMESTAMP"],
y = historicalData.Columns["CLOSE"],
mode = "lines+markers"
}
);
var chart1_layout = new Layout.Layout{
title="Close Price (MSFT.O)",
xaxis =new Graph.Xaxis{
title = "Date"
},
yaxis =new Graph.Yaxis{
title = "Price (USD)"
}
};
chart1.WithLayout(chart1_layout);
chart1
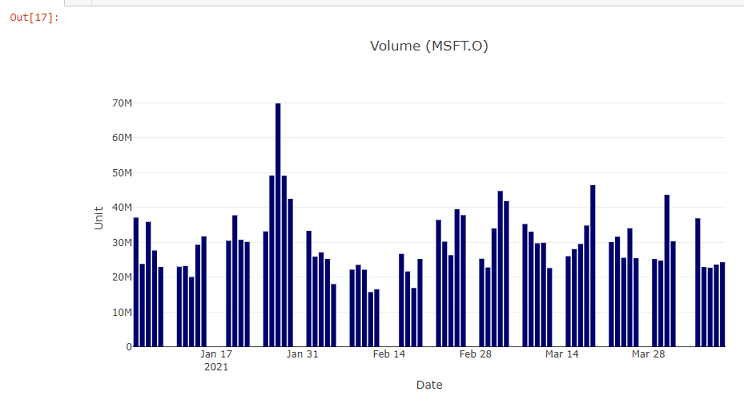
var chart2 = Chart.Plot(
new Graph.Bar
{
x = historicalData.Columns["TIMESTAMP"],
y = historicalData.Columns["VOLUME"],
marker = new Graph.Marker{color = "rgb(0, 0, 109)"}
}
);
var chart2_layout = new Layout.Layout{
title="Volume (MSFT.O)",
xaxis =new Graph.Xaxis{
title = "Date"
},
yaxis =new Graph.Yaxis{
title = "Unit"
}
};
chart2.WithLayout(chart2_layout);
chart2
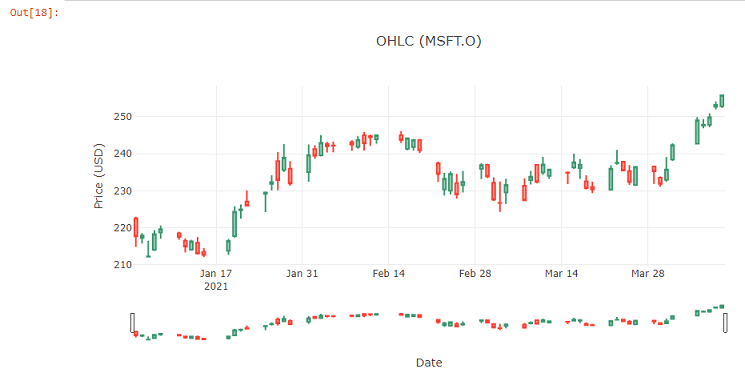
var chart3 = Chart.Candlestick(historicalData.OrderBy("TIMESTAMP").Rows.Select(row => new Tuple<string, double, double, double, double>(
((DateTime)row[1]).ToString("yyyy-MM-dd"),
double.Parse(row[5].ToString()), //OPEN
double.Parse(row[2].ToString()), //HIGH
double.Parse(row[4].ToString()), //LOW
double.Parse(row[3].ToString()) //CLOSE
)));
chart3.WithLayout(new Layout.Layout{
title="OHLC (MSFT.O)",
xaxis =new Graph.Xaxis{
title = "Date"
},
yaxis =new Graph.Yaxis{
title = "Price (USD)"
}
});
Summary
Eikon Data API .NET library is available in Nuget which supports .NET Framework, and .NET core. It provides access to the following content sets through Refinitv desktop products:
- Fundamental and reference data
- Price time series
- News
- Symbology conversion
This article demonstrates how to install and use this library in Jupyter Notebook. It also uses the XPlot.Plotly package which is F# data visualization package to plot charts for the data in the Dataframe.
References
- Fslab.org. n.d. XPlot - F# Data Visualization Package. [online] Available at: https://fslab.org/XPlot/index.html [Accessed 6 May 2021].
- Phuriphanvichai, J., 2018. .NET Libraries for Eikon Data APIs Quick Start | Refinitiv Developers. [online] Developers.refinitiv.com. Available at: https://developers.refinitiv.com/en/article-catalog/article/net-libraries-eikon-data-apis-quick-start [Accessed 10 May 2021].
- Sequeira, J., 2020. dotnet/interactive: Magic Commands. [online] GitHub. Available at: https://github.com/dotnet/interactive/blob/main/docs/magic-commands.md [Accessed 6 May 2021].
- Phuriphanvichai, J., 2021. Using .NET Core in Jupyter Notebook | Refinitiv Developers. [online] Developers.refinitiv.com. Available at: https://developers.refinitiv.com/en/article-catalog/article/using--net-core-in-jupyter-notebook.html [Accessed 10 May 2021].
- Phuriphanvichai, J., 2021. Getting started with C# DataFrame and XPlot.Ploty | Refinitiv Developers. [online] Developers.refinitiv.com. Available at: https://developers.refinitiv.com/en/article-catalog/article/getting-started-with-c--dataframe-and-xplot-ploty.html [Accessed 10 May 2021].