

This article looks at building a Python framework to aid in investigating aggregated Environmental, Social and Governance (ESG) data on companies.
It outlines the fashion in which one may attempt to use Refinitiv's Python Data Application Programming Interface (Python DAPI) to gather ESG data on all companies included in the MSCI World Index and then create graphs to uncover insight behind the data.
This Class built bellow can be used for other data-types, not just ESG data; but it was built for this purpose and only tested as such. Therefore it is named ' ESG_Boolean_Data '
Binary/Boolean Data:
In this article, we will exemplify how one may gather data on
- Environmental Controversies (AnalyticEnvControv)
- Material Sourcing (EnvMaterialsSourcing)
- Environmental Supply Chain Management (EnvSupplyChainMgt)
- Policy Sustainable Packaging (PolicySustainablePackaging)
# The ' from ... import ' structure here allows us to only import the module ' python_version ' from the library ' platform ':
from platform import python_version
print("This code runs on Python version " + python_version())
This code runs on Python version 3.7.7
We use Refinitiv's Eikon Python Application Programming Interface (API) to access financial data. We can access it via the Python library "eikon" that can be installed simply by using pip install.
import eikon as ek
# The key is placed in a text file so that it may be used in this code without showing it itself:
eikon_key = open("eikon.txt","r")
ek.set_app_key(str(eikon_key.read()))
# It is best to close the files we opened in order to make sure that we don't stop any other services/programs from accessing them if they need to:
eikon_key.close()
The following are Python-built-in modules/libraries, therefore they do not have specific version numbers.
# datetime will allow us to manipulate Western World dates
import datetime
# dateutil will allow us to manipulate dates in equations
import dateutil
The Python library 'os' will allow us to retrieve the path of our running script
import os
The Python library 'warnings' will allow us to remove library depreciation warnings
import warnings
# warnings.filterwarnings("ignore")
numpy is needed for datasets' statistical and mathematical manipulations
import numpy
print("The numpy library imported in this code is version: " + numpy.__version__)
The numpy library imported in this code is version: 1.18.5
pandas will be needed to manipulate data sets
import pandas
# This line will ensure that all columns of our dataframes are always shown:
pandas.set_option('display.max_columns', None)
print("The pandas library imported in this code is version: " + pandas.__version__)
The pandas library imported in this code is version: 1.0.5
openpyxl and xlsxwriter will be useful in manipulating Excel workbooks
import openpyxl
import xlsxwriter
print("The openpyxl library imported in this code is version: " + openpyxl.__version__)
print("The xlsxwriter library imported in this code is version: " + xlsxwriter.__version__)
The openpyxl library imported in this code is version: 3.0.3
The xlsxwriter library imported in this code is version: 1.2.9
The bellow are needed to plot graphs of all kinds
import plotly
import plotly.express
from plotly.graph_objs import *
from plotly.offline import download_plotlyjs, init_notebook_mode, plot, iplot
init_notebook_mode(connected = False)
import chart_studio
chart_studio.tools.set_config_file(
plotly_domain='https://chart-studio.plotly.com',
plotly_api_domain='https://plotly.com')
for i,j in zip(["plotly"], [plotly]):
print("The " + str(i) + " library imported in this code is version: " + j.__version__)
The plotly library imported in this code is version: 4.7.1
Coding
Boolean data:
Creating a Python Class
To make this as useful as possible (and to build a more intuitive session for users of our functionalities), the class defined on GitHub (to make this article easier to read) allows anyone to pick and choose the functions and graphs they want (as well as saving an excel workbook with the produced and 'cleaned' data).
Functions to plot graphs:
ESG_Boolean_Data.get_data().Aggregate_Graph:
ESG_Boolean_Data().get_data().Aggregate_Graph() aggregates the data on a per-country basis for each year and returns a plotly line graph. It takes the following arguments:
- Percent (boolean): If 'True', will return data as a ratio (i.e.: percentage) of the total number of companies in the data-set. 'False' will return the actual number of companies in question.
Defaulted to: Percent = False - Line_graph_theme (str): defines the theme of the outputted line graph.
Defaulted as: Line_graph_theme = 'solar'.
Available templates: 'pearl', 'white', 'ggplot', 'solar', 'space'. - Start_graph_year (int): start year of the graph outputted.
Defaulted as: Start_graph_year = 2000. - End_graph_year (int): end year of the graph outputted.
Defaulted as: End_graph_year = 2019. - Type (str): defines the type of chart produced
Defaulted as: Type = "line".
Available templates: "line", "area", "bubble" or "scatter". - Line_shape (str): defines the type of line used in the graphs when ' Type ' is "line" or "area".
Defaulted as: Line_shape = "linear".
Available templates: 'linear', 'spline', 'hv', 'vh', 'hvh', 'vhv' - Bubble_size (int): the maximum bubble size for a "bubble" or "scatter" chart Type.
Defaulted as: Bubble_size = 20 - show_figures (boolean): If True, the charts will be returned one by one.
Defaulted as: show_figures = False - To be added in V2.0:
- save_excel (boolean): If True, it will save an Excel workbook named 'ESGAggregated.xlsx' in the location where this script is being run. If an Excel workbook named 'ESGAggregated.xlsx' already exists, it will add sheets to the existing one.
Defaulted to: save_excel = False.
- save_excel (boolean): If True, it will save an Excel workbook named 'ESGAggregated.xlsx' in the location where this script is being run. If an Excel workbook named 'ESGAggregated.xlsx' already exists, it will add sheets to the existing one.
- Attributes:
- self.df_statics_list: returns a list of all the data-frames constructed (each one aggregating data on a per-static basis for each year).
- self.df_vectorised_list: returns a list of all the 'vectorised' data-frames constructed. They differ from the ' df_statics_list ' data-frames as they are not formatted with years or static fields as columns or rows.
- self.fig: returns a list of all the figures/charts constructed.
ESG_Boolean_Data.get_data().Aggregate_Graph_with_Tot:
ESG_Boolean_Data().get_data().Aggregate_Graph_with_Tot() returns plots that (can) include the total number of datapoints in the data-set for in-chart reference. It takes the following arguments:
- Total_no_in_data_set (boolean): if True, then the total number of data-points in the data-set will be showing in the plot.
Defaulted to: Total_no_in_data_set = True - Color_theme (str): defines the theme of the plotly plot.
Defaulted to: Color_theme = "plotly_dark"
Available templates: "plotly", "plotly_white", "plotly_dark", "ggplot2", "seaborn", "simple_white", "none" - Total_data_shape (str): defines the type of line (&/or markers) used in the graphs.
Defaulted as: Total_data_shape = "line".
Available templates: "lines", "markers", "lines+markers" - show_figures (boolean): If True, the charts will be returned one by one. Defaulted as: show_figures = False
- Percent (boolean): If 'True', will return data as a ratio (i.e.: percentage) of the total number of companies in the data-set. 'False' will return the actual number of companies in question.
Defaulted to: Percent = False - Type (str): defines the type of chart produced.
Defaulted as: Type = "line".
Available templates: "Line", "Scattergl", "XAxis", "Bar", "Scatter", "YAxis", "Margin". - To be added in V 2.0:
- save_excel (boolean): If True, it will save an Excel workbook named 'ESGAggregated.xlsx' in the location where this script is being run. If an Excel workbook named 'ESGAggregated.xlsx' already exists, it will add sheets to the existing one.
Defaulted to: save_excel = False.
- save_excel (boolean): If True, it will save an Excel workbook named 'ESGAggregated.xlsx' in the location where this script is being run. If an Excel workbook named 'ESGAggregated.xlsx' already exists, it will add sheets to the existing one.
- Attributes:
- self.fig: returns a list of all the figures/charts constructed.
- self.statics_list: returns a list of all the data-frames constructed (each one aggregating data on a per-static basis for each year).
ESG_Boolean_Data().get_data().Aggregate_Map_Graph:
ESG_Boolean_Data().get_data().Aggregate_Map_Graph() returns a map representing the asked datapoints per year (with a time slider). It takes the following arguments:
- Color_theme (str): sets the theme of the plotly map displayed.
Defaulted to: Color_theme = "plotly_dark"
Available templates (to be verified): "plotly", "plotly_white", "plotly_dark", "ggplot2", "seaborn", "simple_white", "none" - show_figures (boolean): If True, the charts will be returned one by one.
Defaulted as: show_figures = False - Percent (boolean): If 'True', will return data as a ratio (i.e.: percentage) of the total number of companies in the data-set. 'False' will return the actual number of companies in question.
Defaulted to: Percent = False - Attributes:
- self.fig: returns a list of all the figures/charts constructed.
- self.df_vectorised_list: returns a list of all the data-frames constructed.
Example Uses:
Our Python class can be used in several ways:
Example 1: get_data
ESG_Boolean_Data Python Class Version 1.0: This Python class allows its user to aggregate ESG Boolean Data (i.e.: Data that is 'False' or 'True') for companies within Refinitiv's data-base on a per-static field (be it country, economic sector, ...) basis.
tes0 = ESG_Boolean_Data(Value = "True", Antivalue = "False")
' ESG_Boolean_Data().get_data() ' collects data via Refinitiv's eikon API and 'completes' it (filling in static fields).
tes1 = tes0.get_data(Companies = ['0#.MIWO00000PUS'], # e.g.: SPX, MIWO00000PUS
Fields = ['TR.AnalyticEnvControv',
'TR.EnvMaterialsSourcing',
'TR.EnvSupplyChainMgt',
'TR.PolicySustainablePackaging'],
Static_fields = ['TR.HeadquartersCountry',
'TR.TRBCEconomicSector'])
' .df ' returns the most complete / raw / wholesome data-frame.
tes1.df
| Instrument | Country of Headquarters | TRBC Economic Sector Name | Date | Environmental Controversies | Date | Environmental Materials Sourcing | Date | Environmental Supply Chain Management | Date | Policy Sustainable Packaging | Years | |
| 0 | ZTS.N | United States of America | Healthcare | 2019-12-31T00:00:00Z | FALSE | 2019-12-31T00:00:00Z | TRUE | 2019-12-31T00:00:00Z | TRUE | 2019-12-31T00:00:00Z | TRUE | 2019 |
| 1 | ZTS.N | United States of America | Healthcare | 2018-12-31T00:00:00Z | FALSE | 2018-12-31T00:00:00Z | TRUE | 2018-12-31T00:00:00Z | TRUE | 2018-12-31T00:00:00Z | FALSE | 2018 |
| 2 | ZTS.N | United States of America | Healthcare | 2017-12-31T00:00:00Z | FALSE | 2017-12-31T00:00:00Z | FALSE | 2017-12-31T00:00:00Z | TRUE | 2017-12-31T00:00:00Z | FALSE | 2017 |
| 3 | ZTS.N | United States of America | Healthcare | 2016-12-31T00:00:00Z | FALSE | 2016-12-31T00:00:00Z | FALSE | 2016-12-31T00:00:00Z | TRUE | 2016-12-31T00:00:00Z | FALSE | 2016 |
| 4 | ZTS.N | United States of America | Healthcare | 2015-12-31T00:00:00Z | FALSE | 2015-12-31T00:00:00Z | FALSE | 2015-12-31T00:00:00Z | TRUE | 2015-12-31T00:00:00Z | FALSE | 2015 |
| ... | ... | ... | ... | ... | ... | ... | ... | ... | ... | ... | ... | ... |
| 31751 | CARLb.CO | Denmark | Consumer Non-Cyclicals | 2004-12-31T00:00:00Z | FALSE | 2004-12-31T00:00:00Z | FALSE | 2004-12-31T00:00:00Z | FALSE | 2004-12-31T00:00:00Z | FALSE | 2004 |
| 31752 | CARLb.CO | Denmark | Consumer Non-Cyclicals | 2003-12-31T00:00:00Z | FALSE | 2003-12-31T00:00:00Z | FALSE | 2003-12-31T00:00:00Z | FALSE | 2003-12-31T00:00:00Z | FALSE | 2003 |
| 31753 | CARLb.CO | Denmark | Consumer Non-Cyclicals | 2002-12-31T00:00:00Z | FALSE | 2002-12-31T00:00:00Z | FALSE | 2002-12-31T00:00:00Z | FALSE | 2002-12-31T00:00:00Z | FALSE | 2002 |
| 31754 | CARLb.CO | Denmark | Consumer Non-Cyclicals | 2001-12-31T00:00:00Z | 2001-12-31T00:00:00Z | 2001-12-31T00:00:00Z | 2001-12-31T00:00:00Z | 2001 | ||||
| 31755 | CARLb.CO | Denmark | Consumer Non-Cyclicals | 2000-12-31T00:00:00Z | 2000-12-31T00:00:00Z | 2000-12-31T00:00:00Z | 2000-12-31T00:00:00Z | 2000 | ||||
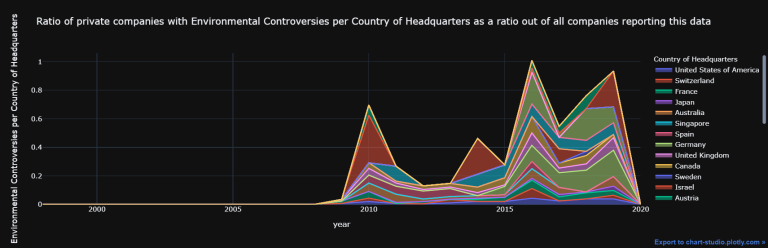
tes2 = tes1.Aggregate_Graph(Percent = True,
Line_graph_theme = 'solar',
Start_graph_year = 2000,
End_graph_year = 2019,
Line_shape = "linear",
save_excel = False,
show_figures = False,
Type = "area",
Bubble_size = 20)
' .fig ' returns a list of all the figures/charts constructed.
# ' config = dict(showLink = True) ' is there to spit out the link at the bottom right:
iplot(tes2.fig[0], config = dict(showLink = True))
tes2.statics_list[0][0]
| Aggregate data on a per Country of Headquarters basis for Environmental Controversies | |||||||||||||||||||||||
| Year | 1998 | 1999 | 2000 | 2001 | 2002 | 2003 | 2004 | 2005 | 2006 | 2007 | 2008 | 2009 | 2010 | 2011 | 2012 | 2013 | 2014 | 2015 | 2016 | 2017 | 2018 | 2019 | 2020 |
| United States of America | 0 | 0 | 0 | 0 | 0 | 0 | 0 | 0 | 0 | 0 | 0 | 0.00718 | 0.02055 | 0.00664 | 0.00444 | 0.01099 | 0.02146 | 0.02087 | 0.04324 | 0.02505 | 0.03915 | 0.03889 | 0 |
| Switzerland | 0 | 0 | 0 | 0 | 0 | 0 | 0 | 0 | 0 | 0 | 0 | 0 | 0.02381 | 0 | 0 | 0.02273 | 0 | 0 | 0.06818 | 0 | 0 | 0.02564 | 0 |
| France | 0 | 0 | 0 | 0 | 0 | 0 | 0 | 0 | 0 | 0 | 0 | 0.01613 | 0.04688 | 0 | 0.01515 | 0 | 0.01493 | 0.02941 | 0.05797 | 0.02817 | 0.04225 | 0.03333 | 0 |
| Japan | 0 | 0 | 0 | 0 | 0 | 0 | 0 | 0 | 0 | 0 | 0 | 0 | 0 | 0.00763 | 0 | 0.00366 | 0.00719 | 0 | 0.01365 | 0.01661 | 0.00654 | 0.03053 | 0 |
| Australia | 0 | 0 | 0 | 0 | 0 | 0 | 0 | 0 | 0 | 0 | 0 | 0 | 0.05882 | 0.05769 | 0.01852 | 0.01818 | 0.01754 | 0.01724 | 0.0678 | 0.04918 | 0 | 0.06667 | 0 |
| Singapore | 0 | 0 | 0 | 0 | 0 | 0 | 0 | 0 | 0 | 0 | 0 | 0 | 0 | 0 | 0 | 0 | 0 | 0 | 0 | 0 | 0 | 0 | 0 |
| Spain | 0 | 0 | 0 | 0 | 0 | 0 | 0 | 0 | 0 | 0 | 0 | 0 | 0.05556 | 0.05556 | 0.05556 | 0.05556 | 0 | 0 | 0.05 | 0 | 0 | 0 | 0 |
| Germany | 0 | 0 | 0 | 0 | 0 | 0 | 0 | 0 | 0 | 0 | 0 | 0 | 0 | 0 | 0 | 0 | 0 | 0.05882 | 0.11321 | 0.10345 | 0.15254 | 0.18519 | 0 |
| United Kingdom | 0 | 0 | 0 | 0 | 0 | 0 | 0 | 0 | 0 | 0 | 0 | 0.01191 | 0.04706 | 0.02299 | 0.01124 | 0.01111 | 0.02222 | 0.01087 | 0.08696 | 0.03261 | 0.04348 | 0.0875 | 0 |
| Canada | 0 | 0 | 0 | 0 | 0 | 0 | 0 | 0 | 0 | 0 | 0 | 0 | 0.03947 | 0.0125 | 0.025 | 0.025 | 0.03798 | 0.04938 | 0.11494 | 0.03488 | 0.05882 | 0.02174 | 0 |
| Sweden | 0 | 0 | 0 | 0 | 0 | 0 | 0 | 0 | 0 | 0 | 0 | 0 | 0 | 0 | 0 | 0 | 0 | 0 | 0 | 0 | 0.02941 | 0 | 0 |
| Israel | 0 | 0 | 0 | 0 | 0 | 0 | 0 | 0 | 0 | 0 | 0 | 0 | 0 | 0 | 0 | 0 | 0 | 0 | 0 | 0.1 | 0 | 0 | 0 |
| Austria | 0 | 0 | 0 | 0 | 0 | 0 | 0 | 0 | 0 | 0 | 0 | 0 | 0 | 0 | 0 | 0 | 0 | 0 | 0 | 0 | 0 | 0 | 0 |
| Belgium | 0 | 0 | 0 | 0 | 0 | 0 | 0 | 0 | 0 | 0 | 0 | 0 | 0 | 0 | 0 | 0 | 0 | 0 | 0 | 0 | 0 | 0 | 0 |
| Denmark | 0 | 0 | 0 | 0 | 0 | 0 | 0 | 0 | 0 | 0 | 0 | 0 | 0 | 0 | 0 | 0 | 0 | 0 | 0 | 0 | 0 | 0 | 0 |
| Netherlands | 0 | 0 | 0 | 0 | 0 | 0 | 0 | 0 | 0 | 0 | 0 | 0 | 0 | 0.10526 | 0 | 0 | 0.09091 | 0.09091 | 0.08696 | 0.08 | 0.07692 | 0.08333 | 0 |
| Ireland; Republic of | 0 | 0 | 0 | 0 | 0 | 0 | 0 | 0 | 0 | 0 | 0 | 0 | 0 | 0 | 0 | 0 | 0 | 0 | 0 | 0 | 0 | 0 | 0 |
| Norway | 0 | 0 | 0 | 0 | 0 | 0 | 0 | 0 | 0 | 0 | 0 | 0 | 0 | 0 | 0 | 0 | 0 | 0 | 0.22222 | 0 | 0.22222 | 0.11111 | 0 |
| Isle of Man | 0 | 0 | 0 | 0 | 0 | 0 | 0 | 0 | 0 | 0 | 0 | 0 | 0 | 0 | 0 | 0 | 0 | 0 | 0 | 0 | 0 | 0 | 0 |
| Hong Kong | 0 | 0 | 0 | 0 | 0 | 0 | 0 | 0 | 0 | 0 | 0 | 0 | 0 | 0 | 0 | 0 | 0 | 0 | 0.0303 | 0.02941 | 0 | 0 | 0 |
| New Zealand | 0 | 0 | 0 | 0 | 0 | 0 | 0 | 0 | 0 | 0 | 0 | 0 | 0 | 0 | 0 | 0 | 0 | 0 | 0 | 0 | 0 | 0 | 0 |
| Luxembourg | 0 | 0 | 0 | 0 | 0 | 0 | 0 | 0 | 0 | 0 | 0 | 0 | 0.33333 | 0 | 0 | 0 | 0.25 | 0 | 0 | 0 | 0 | 0.25 | 0 |
| Italy | 0 | 0 | 0 | 0 | 0 | 0 | 0 | 0 | 0 | 0 | 0 | 0 | 0.07143 | 0 | 0 | 0 | 0 | 0 | 0.05263 | 0.04762 | 0.09091 | 0 | 0 |
| China | 0 | 0 | 0 | 0 | 0 | 0 | 0 | 0 | 0 | 0 | 0 | 0 | 0 | 0 | 0 | 0 | 0 | 0 | 0 | 0 | 0 | 0 | 0 |
| Macau | 0 | 0 | 0 | 0 | 0 | 0 | 0 | 0 | 0 | 0 | 0 | 0 | 0 | 0 | 0 | 0 | 0 | 0 | 0 | 0 | 0 | 0 | 0 |
| Finland | 0 | 0 | 0 | 0 | 0 | 0 | 0 | 0 | 0 | 0 | 0 | 0 | 0 | 0 | 0 | 0 | 0 | 0 | 0 | 0 | 0 | 0 | 0 |
| Argentina | 0 | 0 | 0 | 0 | 0 | 0 | 0 | 0 | 0 | 0 | 0 | 0 | 0 | 0 | 0 | 0 | 0 | 0 | 0 | 0 | 0 | 0 | 0 |
| Bermuda | 0 | 0 | 0 | 0 | 0 | 0 | 0 | 0 | 0 | 0 | 0 | 0 | 0 | 0 | 0 | 0 | 0 | 0 | 0 | 0 | 0 | 0 | 0 |
| Papua New Guinea | 0 | 0 | 0 | 0 | 0 | 0 | 0 | 0 | 0 | 0 | 0 | 0 | 0 | 0 | 0 | 0 | 0 | 0 | 0 | 0 | 0 | 0 | 0 |
| Portugal | 0 | 0 | 0 | 0 | 0 | 0 | 0 | 0 | 0 | 0 | 0 | 0 | 0 | 0 | 0 | 0 | 0 | 0 | 0 | 0 | 0 | 0 | 0 |
tes2.statics_list[1][0].head(2)
| Aggregate data on a per TRBC Economic Sector Name basis for Environmental Controversies | |||||||||||||||||||||||
| Year | 1998 | 1999 | 2000 | 2001 | 2002 | 2003 | 2004 | 2005 | 2006 | 2007 | 2008 | 2009 | 2010 | 2011 | 2012 | 2013 | 2014 | 2015 | 2016 | 2017 | 2018 | 2019 | 2020 |
| Healthcare | 0 | 0 | 0 | 0 | 0 | 0 | 0 | 0 | 0 | 0 | 0 | 0 | 0 | 0 | 0 | 0 | 0 | 0 | 0.03731 | 0 | 0.01379 | 0.0084 | 0 |
| Consumer Non-Cyclicals | 0 | 0 | 0 | 0 | 0 | 0 | 0 | 0 | 0 | 0 | 0 | 0 | 0.01 | 0 | 0 | 0.00926 | 0.00935 | 0.00901 | 0.04237 | 0.0084 | 0.01667 | 0.01087 | 0 |
tes2.statics_list[0][1].head(2)
| Aggregate data on a per Country of Headquarters basis for Environmental Materials Sourcing | |||||||||||||||||||||||
| Year | 1998 | 1999 | 2000 | 2001 | 2002 | 2003 | 2004 | 2005 | 2006 | 2007 | 2008 | 2009 | 2010 | 2011 | 2012 | 2013 | 2014 | 2015 | 2016 | 2017 | 2018 | 2019 | 2020 |
| United States of America | 0 | 0 | 0 | 0 | 0.04651 | 0.04206 | 0.03597 | 0.07463 | 0.08709 | 0.15909 | 0.25521 | 0.3134 | 0.34703 | 0.38717 | 0.39024 | 0.37363 | 0.36481 | 0.33966 | 0.36577 | 0.37746 | 0.41103 | 0.36111 | 0.29167 |
| Switzerland | 0 | 0 | 0 | 0 | 0.17241 | 0.10345 | 0.125 | 0.22857 | 0.14286 | 0.25641 | 0.4 | 0.5 | 0.57143 | 0.53488 | 0.53488 | 0.52273 | 0.56818 | 0.56818 | 0.54546 | 0.65909 | 0.68889 | 0.71795 | 1 |
' .df_vectorised_list' returns a list of all the 'vectorised' data-frames constructed. They differ from the ' df_statics_list ' data-frames as they are not formatted with years or static fields as columns or rows.
tes2.df_vectorised_list[1].head(2)
| Country of Headquarters | year | Environmental Materials Sourcing per Country of Headquarters | |
| 0 | United States of America | 1998 | 0 |
| 1 | United States of America | 1999 | 0 |
tes2.df_vectorised_list[0]
| Country of Headquarters | year | Environmental Controversies per Country of Headquarters | |
| 0 | United States of America | 1998 | 0 |
| 1 | United States of America | 1999 | 0 |
| 2 | United States of America | 2000 | 0 |
| 3 | United States of America | 2001 | 0 |
| 4 | United States of America | 2002 | 0 |
| ... | ... | ... | ... |
| 685 | Portugal | 2016 | 0 |
| 686 | Portugal | 2017 | 0 |
| 687 | Portugal | 2018 | 0 |
| 688 | Portugal | 2019 | 0 |
| 689 | Portugal | 2020 | 0 |
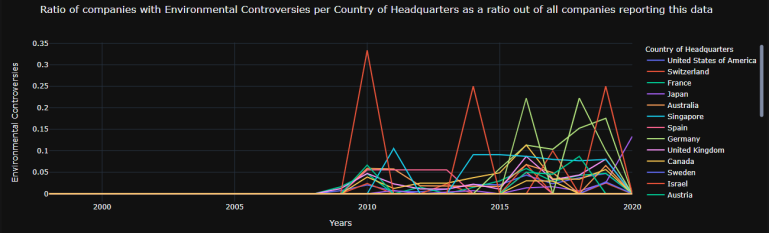
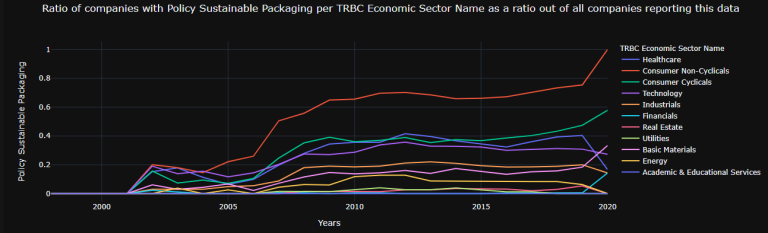
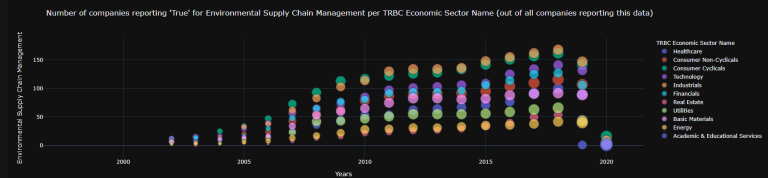
Example 3: 'line' graphs
test2_1 = test1.Aggregate_Graph(Percent = True,
Line_graph_theme = 'solar',
Start_graph_year = 2000,
End_graph_year = 2019,
Type = "line",
Line_shape = "linear",
save_excel = False,
show_figures = False,
Bubble_size = 20)
test2_1.fig[0]
test2_1.fig[7]
Example 4: 'bubble' graphs
The size of the bubbles are relative to the percentage values
test2_2 = test1.Aggregate_Graph(Percent = True,
Line_graph_theme = 'solar',
Start_graph_year = 2000,
End_graph_year = 2019,
Type = "bubble",
Line_shape = "linear",
save_excel = False,
show_figures = False,
Bubble_size = 20)
test2_2.fig[0]
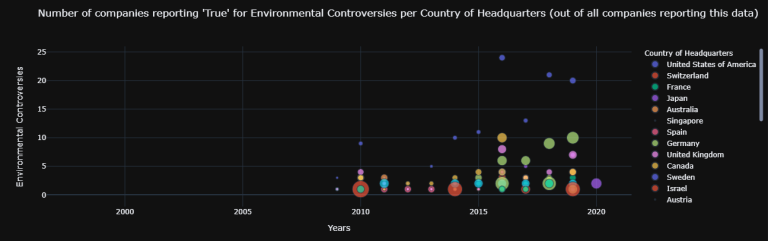
test2_2.fig[6]
tes3 = ESG_Boolean_Data().get_data(Companies = ['0#.MIWO00000PUS'],
Fields = ['TR.AnalyticEnvControv',
'TR.EnvMaterialsSourcing',
'TR.EnvSupplyChainMgt',
'TR.PolicySustainablePackaging'],
Static_fields = ['TR.HeadquartersCountry',
'TR.TRBCEconomicSector'])
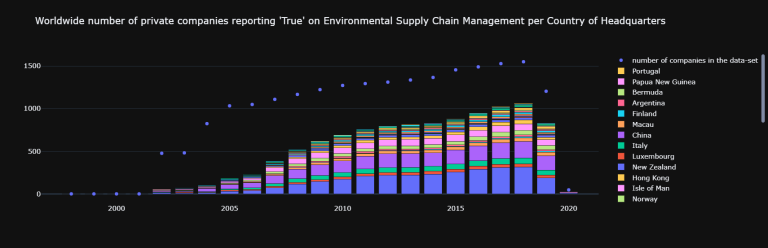
' ESG_Boolean_Data().Aggregate_Graph_with_Tot() ' returns plots that (can) include the total number of datapoints in the data-set for in-chart reference.
tes4 = tes3.Aggregate_Graph_with_Tot(Total_no_in_data_set = True,
Total_data_shape = "markers",
Color_theme = "plotly_dark",
show_figures = False,
Percent = False)
tes4.fig[2]
tes4.statics_list[0][0]
| Aggregate data on a per Country of Headquarters basis for Environmental Controversies | |||||||||||||||||||||||
| Year | 1998 | 1999 | 2000 | 2001 | 2002 | 2003 | 2004 | 2005 | 2006 | 2007 | 2008 | 2009 | 2010 | 2011 | 2012 | 2013 | 2014 | 2015 | 2016 | 2017 | 2018 | 2019 | 2020 |
| United States of America | 0 | 0 | 0 | 0 | 0 | 0 | 0 | 0 | 0 | 0 | 0 | 3 | 9 | 3 | 2 | 5 | 10 | 11 | 24 | 14 | 22 | 14 | 0 |
| Switzerland | 0 | 0 | 0 | 0 | 0 | 0 | 0 | 0 | 0 | 0 | 0 | 0 | 1 | 0 | 0 | 1 | 0 | 0 | 3 | 0 | 0 | 1 | 0 |
| France | 0 | 0 | 0 | 0 | 0 | 0 | 0 | 0 | 0 | 0 | 0 | 1 | 3 | 0 | 1 | 0 | 1 | 2 | 4 | 2 | 3 | 2 | 0 |
| Japan | 0 | 0 | 0 | 0 | 0 | 0 | 0 | 0 | 0 | 0 | 0 | 0 | 0 | 2 | 0 | 1 | 2 | 0 | 4 | 5 | 2 | 8 | 0 |
| Australia | 0 | 0 | 0 | 0 | 0 | 0 | 0 | 0 | 0 | 0 | 0 | 0 | 3 | 3 | 1 | 1 | 1 | 1 | 4 | 3 | 0 | 4 | 0 |
| Singapore | 0 | 0 | 0 | 0 | 0 | 0 | 0 | 0 | 0 | 0 | 0 | 0 | 0 | 0 | 0 | 0 | 0 | 0 | 0 | 0 | 0 | 0 | 0 |
| Spain | 0 | 0 | 0 | 0 | 0 | 0 | 0 | 0 | 0 | 0 | 0 | 0 | 1 | 1 | 1 | 1 | 0 | 0 | 1 | 0 | 0 | 0 | 0 |
| Germany | 0 | 0 | 0 | 0 | 0 | 0 | 0 | 0 | 0 | 0 | 0 | 0 | 0 | 0 | 0 | 0 | 0 | 3 | 6 | 6 | 9 | 10 | 0 |
| United Kingdom | 0 | 0 | 0 | 0 | 0 | 0 | 0 | 0 | 0 | 0 | 0 | 1 | 4 | 2 | 1 | 1 | 2 | 1 | 8 | 3 | 4 | 7 | 0 |
| Canada | 0 | 0 | 0 | 0 | 0 | 0 | 0 | 0 | 0 | 0 | 0 | 0 | 3 | 1 | 2 | 2 | 3 | 4 | 10 | 3 | 5 | 1 | 0 |
| Sweden | 0 | 0 | 0 | 0 | 0 | 0 | 0 | 0 | 0 | 0 | 0 | 0 | 0 | 0 | 0 | 0 | 0 | 0 | 0 | 0 | 1 | 0 | 0 |
| Israel | 0 | 0 | 0 | 0 | 0 | 0 | 0 | 0 | 0 | 0 | 0 | 0 | 0 | 0 | 0 | 0 | 0 | 0 | 0 | 1 | 0 | 0 | 0 |
| Austria | 0 | 0 | 0 | 0 | 0 | 0 | 0 | 0 | 0 | 0 | 0 | 0 | 0 | 0 | 0 | 0 | 0 | 0 | 0 | 0 | 0 | 0 | 0 |
| Belgium | 0 | 0 | 0 | 0 | 0 | 0 | 0 | 0 | 0 | 0 | 0 | 0 | 0 | 0 | 0 | 0 | 0 | 0 | 0 | 0 | 0 | 0 | 0 |
| Denmark | 0 | 0 | 0 | 0 | 0 | 0 | 0 | 0 | 0 | 0 | 0 | 0 | 0 | 0 | 0 | 0 | 0 | 0 | 0 | 0 | 0 | 0 | 0 |
| Netherlands | 0 | 0 | 0 | 0 | 0 | 0 | 0 | 0 | 0 | 0 | 0 | 0 | 0 | 2 | 0 | 0 | 2 | 2 | 2 | 2 | 2 | 2 | 0 |
| Ireland; Republic of | 0 | 0 | 0 | 0 | 0 | 0 | 0 | 0 | 0 | 0 | 0 | 0 | 0 | 0 | 0 | 0 | 0 | 0 | 0 | 0 | 0 | 0 | 0 |
| Norway | 0 | 0 | 0 | 0 | 0 | 0 | 0 | 0 | 0 | 0 | 0 | 0 | 0 | 0 | 0 | 0 | 0 | 0 | 2 | 0 | 2 | 1 | 0 |
| Isle of Man | 0 | 0 | 0 | 0 | 0 | 0 | 0 | 0 | 0 | 0 | 0 | 0 | 0 | 0 | 0 | 0 | 0 | 0 | 0 | 0 | 0 | 0 | 0 |
| Hong Kong | 0 | 0 | 0 | 0 | 0 | 0 | 0 | 0 | 0 | 0 | 0 | 0 | 0 | 0 | 0 | 0 | 0 | 0 | 1 | 1 | 0 | 0 | 0 |
| New Zealand | 0 | 0 | 0 | 0 | 0 | 0 | 0 | 0 | 0 | 0 | 0 | 0 | 0 | 0 | 0 | 0 | 0 | 0 | 0 | 0 | 0 | 0 | 0 |
| Luxembourg | 0 | 0 | 0 | 0 | 0 | 0 | 0 | 0 | 0 | 0 | 0 | 0 | 1 | 0 | 0 | 0 | 1 | 0 | 0 | 0 | 0 | 1 | 0 |
| Italy | 0 | 0 | 0 | 0 | 0 | 0 | 0 | 0 | 0 | 0 | 0 | 0 | 1 | 0 | 0 | 0 | 0 | 0 | 1 | 1 | 2 | 0 | 0 |
| China | 0 | 0 | 0 | 0 | 0 | 0 | 0 | 0 | 0 | 0 | 0 | 0 | 0 | 0 | 0 | 0 | 0 | 0 | 0 | 0 | 0 | 0 | 0 |
| Macau | 0 | 0 | 0 | 0 | 0 | 0 | 0 | 0 | 0 | 0 | 0 | 0 | 0 | 0 | 0 | 0 | 0 | 0 | 0 | 0 | 0 | 0 | 0 |
| Finland | 0 | 0 | 0 | 0 | 0 | 0 | 0 | 0 | 0 | 0 | 0 | 0 | 0 | 0 | 0 | 0 | 0 | 0 | 0 | 0 | 0 | 0 | 0 |
| Argentina | 0 | 0 | 0 | 0 | 0 | 0 | 0 | 0 | 0 | 0 | 0 | 0 | 0 | 0 | 0 | 0 | 0 | 0 | 0 | 0 | 0 | 0 | 0 |
| Bermuda | 0 | 0 | 0 | 0 | 0 | 0 | 0 | 0 | 0 | 0 | 0 | 0 | 0 | 0 | 0 | 0 | 0 | 0 | 0 | 0 | 0 | 0 | 0 |
| Papua New Guinea | 0 | 0 | 0 | 0 | 0 | 0 | 0 | 0 | 0 | 0 | 0 | 0 | 0 | 0 | 0 | 0 | 0 | 0 | 0 | 0 | 0 | 0 | 0 |
| Portugal | 0 | 0 | 0 | 0 | 0 | 0 | 0 | 0 | 0 | 0 | 0 | 0 | 0 | 0 | 0 | 0 | 0 | 0 | 0 | 0 | 0 | 0 | 0 |
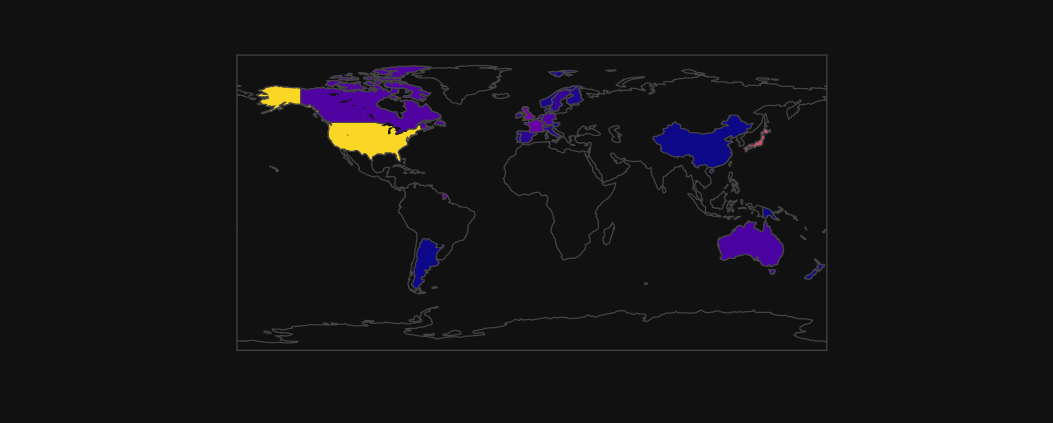
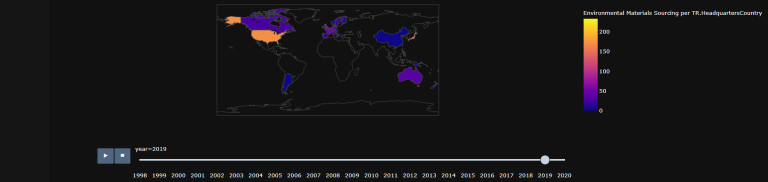
Example 6: Aggregate_Map_Graph
Map our Data:
tes5 = ESG_Boolean_Data().get_data(Companies = ['0#.MIWO00000PUS'],
Fields = ['TR.AnalyticEnvControv',
'TR.EnvMaterialsSourcing',
'TR.EnvSupplyChainMgt',
'TR.PolicySustainablePackaging'],
Static_fields = ['TR.HeadquartersCountry',
'TR.TRBCEconomicSector'])
' ESG_Boolean_Data().Aggregate_Map_Graph() ' returns a map representing the asked datapoints per year (with a time slider).
tes6 = tes5.Aggregate_Map_Graph(Color_theme = "plotly_dark",
show_figures = False,
Percent = False)
tes6.fig[2]
tes5.df
| Instrument | Country of Headquarters | TRBC Economic Sector Name | Date | Environmental Controversies | Date | Environmental Materials Sourcing | Date | Environmental Supply Chain Management | Date | Policy Sustainable Packaging | Years | |
| 0 | ZTS.N | United States of America | Healthcare | 2019-12-31T00:00:00Z | FALSE | 2019-12-31T00:00:00Z | TRUE | 2019-12-31T00:00:00Z | TRUE | 2019-12-31T00:00:00Z | TRUE | 2019 |
| 1 | ZTS.N | United States of America | Healthcare | 2018-12-31T00:00:00Z | FALSE | 2018-12-31T00:00:00Z | TRUE | 2018-12-31T00:00:00Z | TRUE | 2018-12-31T00:00:00Z | FALSE | 2018 |
| 2 | ZTS.N | United States of America | Healthcare | 2017-12-31T00:00:00Z | FALSE | 2017-12-31T00:00:00Z | FALSE | 2017-12-31T00:00:00Z | TRUE | 2017-12-31T00:00:00Z | FALSE | 2017 |
| 3 | ZTS.N | United States of America | Healthcare | 2016-12-31T00:00:00Z | FALSE | 2016-12-31T00:00:00Z | FALSE | 2016-12-31T00:00:00Z | TRUE | 2016-12-31T00:00:00Z | FALSE | 2016 |
| 4 | ZTS.N | United States of America | Healthcare | 2015-12-31T00:00:00Z | FALSE | 2015-12-31T00:00:00Z | FALSE | 2015-12-31T00:00:00Z | TRUE | 2015-12-31T00:00:00Z | FALSE | 2015 |
| ... | ... | ... | ... | ... | ... | ... | ... | ... | ... | ... | ... | ... |
| 31751 | CARLb.CO | Denmark | Consumer Non-Cyclicals | 2004-12-31T00:00:00Z | FALSE | 2004-12-31T00:00:00Z | FALSE | 2004-12-31T00:00:00Z | FALSE | 2004-12-31T00:00:00Z | FALSE | 2004 |
| 31752 | CARLb.CO | Denmark | Consumer Non-Cyclicals | 2003-12-31T00:00:00Z | FALSE | 2003-12-31T00:00:00Z | FALSE | 2003-12-31T00:00:00Z | FALSE | 2003-12-31T00:00:00Z | FALSE | 2003 |
| 31753 | CARLb.CO | Denmark | Consumer Non-Cyclicals | 2002-12-31T00:00:00Z | FALSE | 2002-12-31T00:00:00Z | FALSE | 2002-12-31T00:00:00Z | FALSE | 2002-12-31T00:00:00Z | FALSE | 2002 |
| 31754 | CARLb.CO | Denmark | Consumer Non-Cyclicals | 2001-12-31T00:00:00Z | 2001-12-31T00:00:00Z | 2001-12-31T00:00:00Z | 2001-12-31T00:00:00Z | 2001 | ||||
| 31755 | CARLb.CO | Denmark | Consumer Non-Cyclicals | 2000-12-31T00:00:00Z | 2000-12-31T00:00:00Z | 2000-12-31T00:00:00Z | 2000-12-31T00:00:00Z | 2000 |
References
You can find more detail regarding the Eikon Data API and related technologies for this notebook from the following resources:
- Refinitiv Eikon Data API page on the Refinitiv Developer Community web site.
- Eikon Data API Quick Start Guide page.
- Eikon Data API Tutorial page.
- Python Quants Video Tutorial Series for Eikon API.
- Eikon Data API Troubleshooting article.
- Pandas API Reference.
For any question related to this example or Eikon Data API, please use the Developers Community Q&A Forum.