

Introduction
ESG (environmental, social and governance) factors in investment analysis and management are a hot topic. There’s been an explosive growth in ESG investing. According to Global Sustainable Investment Review 2018 published by Global Sustainable Investment Alliance (GSIA), sustainable investing assets stood at $30.7 trillion at the start of 2018, a 34% increase over two years period. The largest sustainable investment strategy globally is negative/exclusionary screening, which accounts for $19.8 trillion, followed by ESG integration defined as “systematic and explicit inclusion by investment managers of environmental, social and governance factors into financial analysis” and accounting for $17.5 trillion.
While ESG investment strategies have firmly entered the mainstream of the investment industry, little to no standardization has emerged yet in ESG reporting and disclosure.
This article examines the ESG metrics available from Refinitiv ESG dataset and explores the distribution of ESG disclosures across these metrics. We then probe whether the sheer number of ESG disclosures a company makes (regardless of the values of these disclosures or their polarity – whether a higher score is "good" or "bad") is associated with better stock price performance or company profitability metrics such as return on assets (ROA) or return on equity (ROE).
ESG Disclosure Distribution
There's no single standard list of ESG metrics used by companies, governments, self-regulating bodies or investors. ESG disclosures are largely voluntary and the list of ESG metrics a company reports varies greatly from one company to another, even if one looks at similar size companies from the same industry and geography. We're going to explore the availability of Environmental, Social & Governance metrics for a list of companies, and determine the percentage of constituent companies that disclose information for each of the ESG metrics available from Refinitiv ESG dataset. For this example we chose as the list of stocks the constituents of MSCI ACWI: a global broad market equity index comprised of large- and mid-cap stocks across 23 developed and 26 emerging markets.
We retrieve the list of ESG fields from a CSV file where the metrics availbale from Refinitiv ESG set are divided into several categories. The two categories we use here are "performance" and "policy" metrics. "Policy" metrics are Boolean in nature. They tell whether a company has specific policy such as for instance a data privacy or a fair trade policy. "Performance" metrics mostly provide quantified or descriptive values such as for example the amount of CO2 emissions, although some provide Boolean values (e.g. TR.ProfitWarnings, which states whether the company issued a profit warning during the year). This categorization into "performance" and "policy" metrics is somewhat subjective. There are metrics that could be considered for both categories, e.g. TR.PoisonPill, which states whether the company has adopted a poison pill (a shareholders rights plan, macaroni defense or a similar provision protecting the company against hostile takeover). We chose to categorize TR.PoisonPill as "performance" metric. You may want to rearrange the metrics across categories according to your perception or investment model.
In [2]:
# The RIC for MSCI ACWI
index_RIC = '.dMIWD00000PUS'
instr, err = ek.get_data(index_RIC,['TR.IndexConstituentRIC'])
# ensure that RICs are in a list object
instr = instr['Constituent RIC'].tolist()
# Remove duplicates, None and empty strings from the list
instr = list(dict.fromkeys(instr))
instr = list(filter(None, instr))
instr = list(filter(str.strip, instr))
esg_fields_df = pd.read_csv('ESGFieldCategories.csv')
perf_fields = esg_fields_df['Performance'].dropna().tolist()
pol_fields = esg_fields_df['Policy'].dropna().tolist()
df_perf, err = ek.get_data(instr, perf_fields)
df_perf.set_index('Instrument', inplace = True)
df_pol, err = ek.get_data(instr, pol_fields)
df_pol.set_index('Instrument', inplace = True)
There are two reasons why we divided ESG metrics into these categories. One reason is based on the popular perception that Boolean metrics offer limited information and comparability and therefore should play a lesser role in the investment model. The other reason is purely technical. For "policy" metrics the value retrieved may be True, False or empty/null. Since no company ever includes in its reports that it doesn't have a specific policy, only the value of True constitutes a disclosure on a "policy" metric. The value of False, just like an empty or null value, constitutes the lack of disclosure. For "performance" metrics however any value that is not empty or null (including the value of False) is counted as a disclosure.
In [3]:
# Return number of non-NA/null observations from the Refinitiv ESG performance metrics
df_plot = df_perf.count() - (df_perf == '').sum()
# Return number of 'True' observations from Refinitiv ESG policy metrics
df_plot = df_plot.append((df_pol == 'True').sum())
# Prepare non-NA/null & 'True' observations for chart plot
df_plot = 100*df_plot/len(instr)
df_plot.sort_values(inplace = True, ascending = False)
fig = go.Figure(go.Bar(x=df_plot.index, y=df_plot.values),
go.Layout(xaxis_tickangle=-45,
title='Percentage of index constituents reporting on each ESG Metric',
xaxis = {'tickfont_size':6},
yaxis = {'ticksuffix':'%'}))
fig.show()
Out [3]:
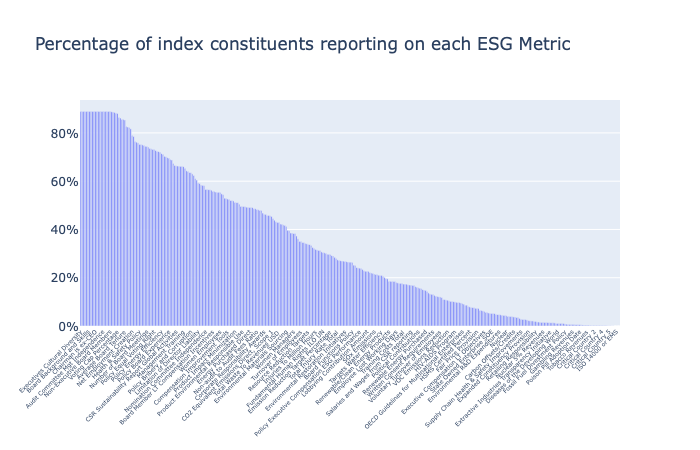
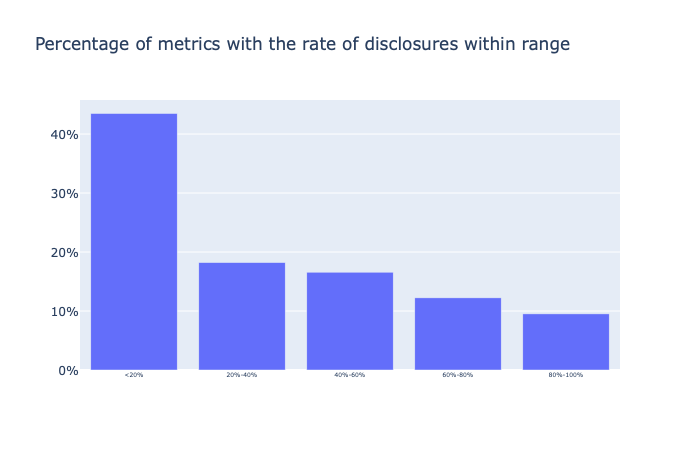
As you can see from the above chart there's great variation in the availability of ESG disclosures by metric. While Executives Cultural Diversity (percentage of senior executives that have a cultural background different from the location of the corporate headquarters) is available for almost 89% of companies in MSCI ACWI, there's a long tail of metrics with low availability of disclosures. As of the end of year 2019 43% of metrics in our list have less than 20% disclosure rate. In other words for 43% of ESG metrics in our list the latest data is available for less than 20% of companies in MSCI ACWI.
In [4]:
# Breake the number of disclosures into 20% brackets
df_group = df_plot.groupby(pd.cut(df_plot, np.arange(0, 101, 20),include_lowest=True)).count()*100/len(df_plot)
fig = go.Figure(go.Bar(x=['<20%','20%-40%','40%-60%','60%-80%','80%-100%'], y=df_group.values),
go.Layout(
title='Percentage of metrics with the rate of disclosures within range',
xaxis = {'tickfont_size':6},
yaxis = {'ticksuffix':'%'}))
fig.show()
Out [4]:
ESG disclosures vs. investment metrics
Now we're going to examine the relationship between the number of ESG disclosures a company makes and investment metrics such as Alpha or Return on Assets.
We use Eikon Screener to retrieve the list of companies headquartered in the US, falling into Industrials economic sector according to TRBC sector classification scheme (the value of TR.TRBCEconSectorCode field equals 52) and with market cap over 10 billion USD. This code can be easily modified to use
- other criteria with Screener
- to retrieve constituents of an index, e.g. ek.get_data('0#.SPX','DSPLY_NAME')[0]['Instrument'].tolist() returns the constituents of S&P 500
- import portfolio setup in Eikon
- import custom list of stocks
In [2]:
screener_exp = '''SCREEN(U(IN(Equity(active,public,primary))), IN(TR.HQCountryCode,"US"),
IN(TR.TRBCEconSectorCode,"52"), TR.CompanyMarketCap>=10000000000, CURN=USD)'''
instr = ek.get_data(screener_exp,'DSPLY_NAME')[0]['Instrument'].tolist()
#Remove duplicates, None and empty strings from the list
instr = list(dict.fromkeys(instr))
instr = list(filter(None, instr))
instr = list(filter(str.strip, instr))
Just as before we're uing the list of ESG fields retrieved from ESGFieldCategories.csv file and split between "performance" and "policy" categories.
In [3]:
esg_fields_df = pd.read_csv('ESGFieldCategories.csv')
perf_fields = esg_fields_df['Performance'].dropna().tolist()
pol_fields = esg_fields_df['Policy'].dropna().tolist()
df_perf, err = ek.get_data(instr, perf_fields)
df_perf.set_index('Instrument', inplace = True)
df_pol, err = ek.get_data(instr, pol_fields)
df_pol.set_index('Instrument', inplace = True)
Now from our list of companies we select top 20% by the number of disclosures on performance and policy metrics. Here we only consider whether specific metric is populated for the company, not the value of the metric or its polarity (whether a higher score is "good" or "bad"). For performance metrics we're counting all values that are non-NA and not empty strings. For policy metrics we're only counting values that are True because for these metrics values that are False or empty have the same meaning: companies never report that they don't have a specific policy, they only disclose the policies they do have.
In [4]:
# determine top 20% of the companies by disclosure on performance metrics
best_stocks_by_perf_df = (df_perf.count(axis=1) - (df_perf == '').sum(axis=1)).nlargest(int(len(instr)/5))
best_stocks_by_perf_df
Out [4]:
Instrument
NOC.N 112
UPS.N 109
MMM.N 108
KEYS.N 107
NSC.N 104
MTD.N 104
XYL.N 104
FDX.N 103
WM.N 103
LMT.N 100
CSX.OQ 100
SPGI.N 98
LUV.N 96
dtype: int64
In [5]:
# determine top 20% of the companies by disclosure on policy metrics
best_stocks_by_pol_df = (df_pol == 'True').sum(axis=1).nlargest(int(len(instr)/5))
best_stocks_by_pol_df
Out [5]:
Instrument
MMM.N 115
GE.N 109
UTX.N 105
LMT.N 102
KEYS.N 101
HON.N 100
XYL.N 96
BA.N 95
WM.N 94
NOC.N 93
SWK.N 93
NSC.N 92
FDX.N 89
dtype: int64
The lists of top 20% of companies by the number of disclosures on performance and policy metrics will generally not be the same, however it's likely that there will be an overlap between the two lists.
In [6]:
# Calculate the overlap between top 20% by performance and policy metrics
best_stocks_by_perf_list = best_stocks_by_perf_df.index.tolist()
best_stocks_by_pol_list = best_stocks_by_pol_df.index.tolist()
print('The overlap between top 20% by disclosure on performance metrics and on policy metrics:')
print("{0:.0%}".format(len([x for x in best_stocks_by_perf_list if x in best_stocks_by_pol_list])
/len(best_stocks_by_pol_list)))
Out [6]:
The overlap between top 20% by disclosure on performance metrics and on policy metrics:
62%
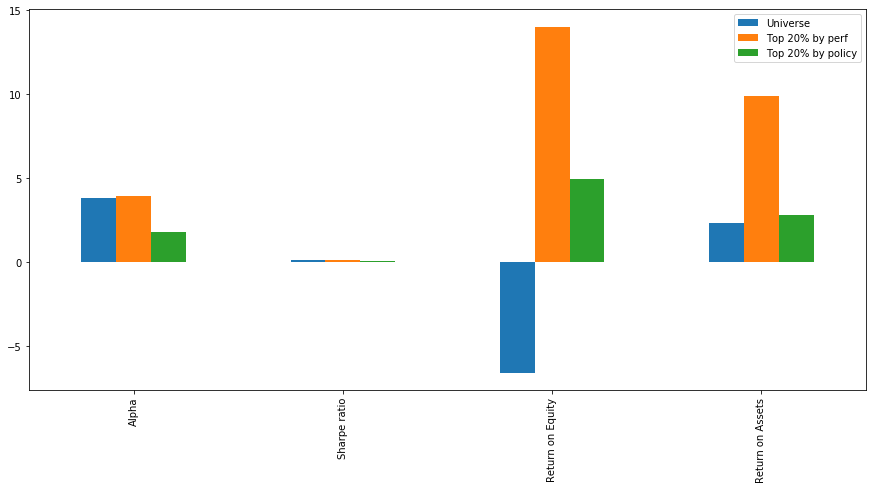
Now we can compare the averages of investment metrics between the lists of top 20% by the number of populated ESG policy and performance metrics vs. the full universe of stocks in our research. For this universe of stocks (large cap US industrials) we can conclude that higher number of ESG disclosures does not translate into better stock price performance measured by Alpha or Sharpe ratio. However it appears that stocks with the highest number of ESG disclosures significantly outperform its peers on profitability measures such as return on equity and return on assets. We can also see that the number of disclosures on performance metrics is of much greater significance than the number of disclosures on policy metrics.
In [7]:
univ_df, err = ek.get_data(instr,['GAVG(TR.AlphaMthly5Y,universe="univ")',
'GAVG(TR.SharpeRatioMthly5Y,universe="univ")',
'GAVG(TR.InvtrReturnOnEquity,universe="univ")',
'GAVG(TR.InvtrReturnOnAssets,universe="univ")'])
perf_df, err = ek.get_data(best_stocks_by_perf_list,['GAVG(TR.AlphaMthly5Y,universe="univ")',
'GAVG(TR.SharpeRatioMthly5Y,universe="univ")',
'GAVG(TR.InvtrReturnOnEquity,universe="univ")',
'GAVG(TR.InvtrReturnOnAssets,universe="univ")'])
pol_df, err = ek.get_data(best_stocks_by_pol_list,['GAVG(TR.AlphaMthly5Y,universe="univ")',
'GAVG(TR.SharpeRatioMthly5Y,universe="univ")',
'GAVG(TR.InvtrReturnOnEquity,universe="univ")',
'GAVG(TR.InvtrReturnOnAssets,universe="univ")'])
plot_df = pd.DataFrame({'Universe': univ_df.iloc[0,1:].tolist(),
'Top 20% by perf': perf_df.iloc[0,1:].tolist(),
'Top 20% by policy': pol_df.iloc[0,1:].tolist()},
index=['Alpha','Sharpe ratio','Return on Equity','Return on Assets'])
ax = plot_df.plot.bar(figsize=(15,7))
Out [7]:
Complete source code for this article can be downloaded from Github
https://github.com/Refinitiv-API-Samples/Article.EikonAPI.Python.ESGDisclosuresDistribution
https://github.com/Refinitiv-API-Samples/Article.EikonAPI.Python.ESGDisclosuresVsInvestmentMetrics