

Introduction
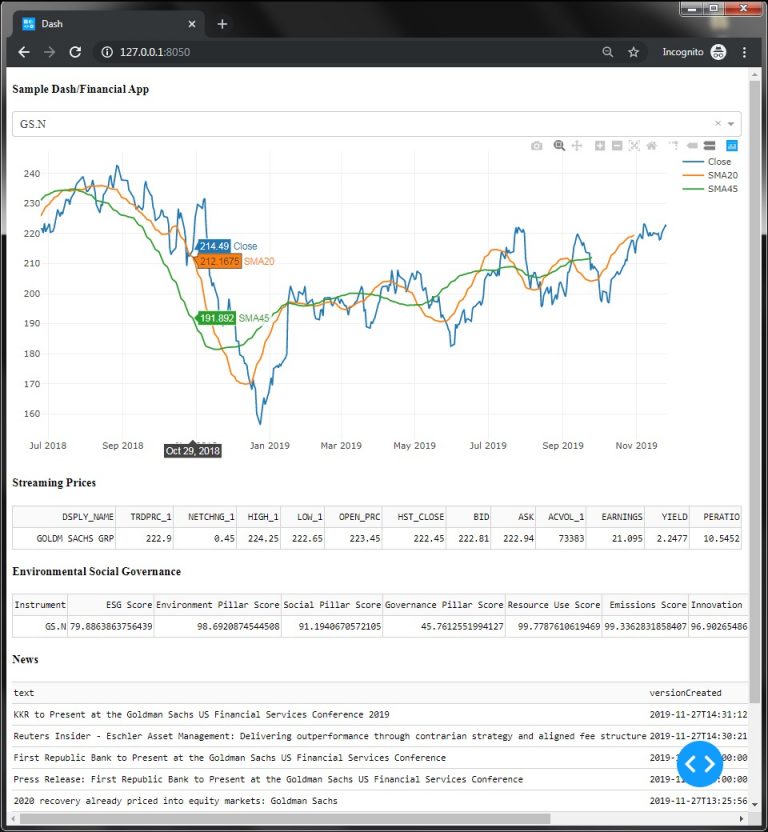
This article showcases the use of Refinitiv Data Platform library, to source data from the platform, to build a financial dashboard. The dashboard presents a list of instruments, and for any selected instrument, it shows a price chart with moving averages along with real-time streaming data, the Environment Social Governance (ESG) scores and the latest news headlines. Upon clicking a headline the corresponding news story snippet is shown.
Technologies
The dashboard is built using the new Refinitiv Data Platform library for Python, and it sources data from Refinitiv Data platform (RDP). The RDP provides access to variety of data types through RESTful API and streaming data via websockets. All the underlying mechanisms of accessing the API and parsing the response, etc. are encapsulated by the library which provides a high level content layer.
Besides the RDP library, the application uses Plotly/Dash framework to present the dashboard to user. Dash uses a web-based front end to present a user layer, while executing the python code at the backend. This cleanly separates the user interface from business logic.
See examples and read more about Dash framework here.
Basic structure
A dash application consists of a layout and application logic.
Dash Layout
Following code snippet sets up the user interface. It is a command to generate html code for the browser and uses Dash helper objects like Dropdown, Graph etc, intermingled with native html elements like div's and buttons. At run time this code translate to a html list, Plotly Graph etc., within another html div which is placed on the page body.
app.layout = html.Div([
html.H4('Sample Dash/Financial App'),
dcc.Dropdown(id='my-dropdown',
options = [{'label': i, 'value': i} for i in dow30List],
value = dow30List[0]
),
dcc.Loading(id="spinner-1", children=[html.Div(id="spinner-output-1")], type="circle", color='#FF0000'),
dcc.Graph(id='my-graph'),
.
.
.
html.Div(children=[
html.Button('Close', id='cButton'),
dcc.Markdown(id='sText')
], id='story', style={"display": "none"})
])
While the above code is enough to generate the application layout, these objects do not provide any user interaction on their own. The application has to provide the glue code, in the form of event-callbacks which is invoked whenever a user interacts with the dashboard. The return data from such an invoked callback results in updated web page.
Dash Callbacks
Dash callbacks have following method signature - an array containing the list of output objects which are affected by invoking this call, and an array containing the list of inputs which result in invoking this call:
@app.callback([Output('news', 'data'), Output('my-graph', 'figure')], [Input('my-dropdown', 'value')])
def update_view(selected_dropdown_value):
Here, the method update_view is called for every change in the value of my-dropdown list. In turn output tags signify that this function returns new data for news and graph objects defined on the page. Hence, any change in list selection will automatically result in updated display for news and graph.
A few callbacks are used in the sample application. The primary one identified above is used to update most of the display elements. Other callbacks are used to display a news story pop-up, when ever a news headline is clicked. Its method signature is:
@app.callback([Output('story', 'style'), Output('sText', 'children')], [Input('news', 'active_cell')], [State('news', 'data')])
def update_rows(activeCell, data):
This sample dashboard also shows real-time streaming data. This type of data is asynchronous, with data updates occurring at any random time. Since Dash framework does not provide a mechanism to push asynchronous data into the UI; an alternative method of using a timer based callback, is used. This callback reads current data from a streaming cache and updates the page periodically:
@app.callback(Output('rtData', 'data'), [Input('interval', 'n_intervals')])
def update_realTimeData(n):
The content layer of RDP library is used for getting news, historical prices chart and streaming data in this sample dashboard. At the time of writing, the ESG metrics are not available in the content layer, so a low level function layer API calls are used to demonstrate how to invoke a RDP Rest'ful URL and parse the response JSON data and extract the desired dataset.
esgResponse = esgDataEndpoint.send_request(query_parameters = {"universe": selected_dropdown_value})
if esgResponse.is_success:
fd = esgResponse.data.raw
headers = [h['title'] for h in fd['headers']]
esg_result = [dict(zip(headers, fd['data'][0]))]
Putting it together
See complete source code for this Dashboard application on the Refinitiv API Samples github site.
Prerequisites
- Install Dash framework for Python: pip install Dash
- Install RDP library for Python: pip install refinitiv.dataplatform
- Have credentials to retrieve snapshot and streaming data from Refinitiv Data Platform.
- Machine ID
- Password
- App Key aka Client ID
- Be permissioned for Historical Timeseries API, ESG API, News API and ERT in Cloud streaming data.
Run
- Start the Dash application: python edpapp_Content.py
- Navigate the browser to URL: http://127.0.0.1:8050/
Select the symbol from the dropdown list. Clicking on News headline will pop open the News story.
Source Code