
This example demonstrates how to retrieve World Development Indicators from DataStream Web Services and then use Google Maps (gmaps) to create a heatmap with the retrieved data. To run the example, the DataStream account and Google Maps' API key are required. To use other maps, such as Geopandas, please refer to this article.
To get the Google Maps' API key, please refer to Get an API Key.
This example creates a heatmap of the yearly deposit interest rate (%) across countries. However, it can be applied to any World Development Indicators.
Loading required packages
The required packages for this example are:
- DataStreamDSWS: Python API package for Refinitiv Datastream Webservice
- pandas: Powerful data structures for data analysis, time series, and statistics
- numpy: NumPy is the fundamental package for array computing with Python
- gmaps: Google maps plugin for Jupyter notebooks
- IPython.display: Public API for display tools in IPython
- ipywidgets: IPython HTML widgets for Jupyter
You also need to install lxml package (pip install lxml) used by pandas when parsing the HTML file.
import DatastreamDSWS as DSWS
import pandas as pd
import numpy as np
import gmaps
from IPython.display import display
import ipywidgets as widgets
Setting credentials
The DataStream account and Google Maps' API key are required to run the example.
ds = DSWS.Datastream(username = '<username>', password = '<password>')
gmaps.configure(api_key='<api_key>')
Loading an instrument list
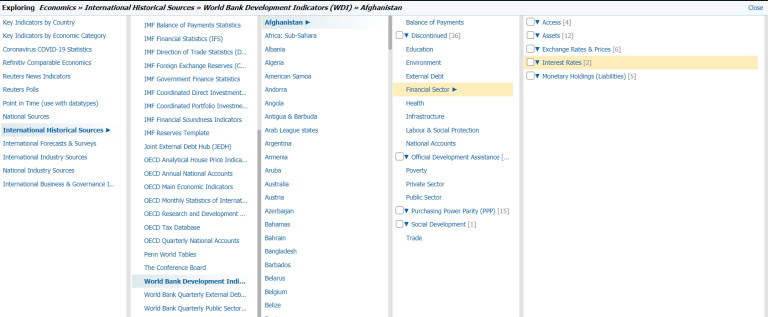
In DataStream, the World Development Indicators are available under the Economics » International Historical Sources » World Bank Development Indicators (WDI) category. The data is categorized by countries.
You can use the indication name to search for instruments of all available countries, and then refine the search results by selecting the results from World Bank WDI. For example, the search query for Deposit Interest Rate (%) from World Bank WDI is "DESC:and(Deposit Interest Rate (%)) DSSRC:and(World Bank WDI)".
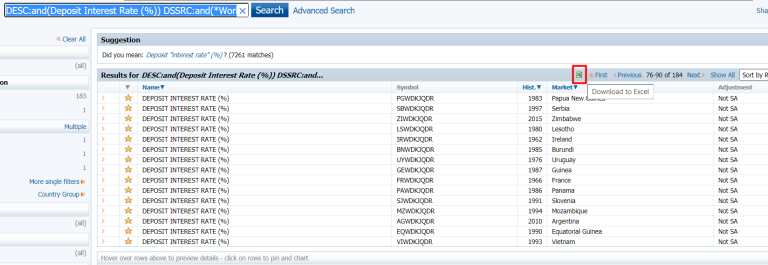
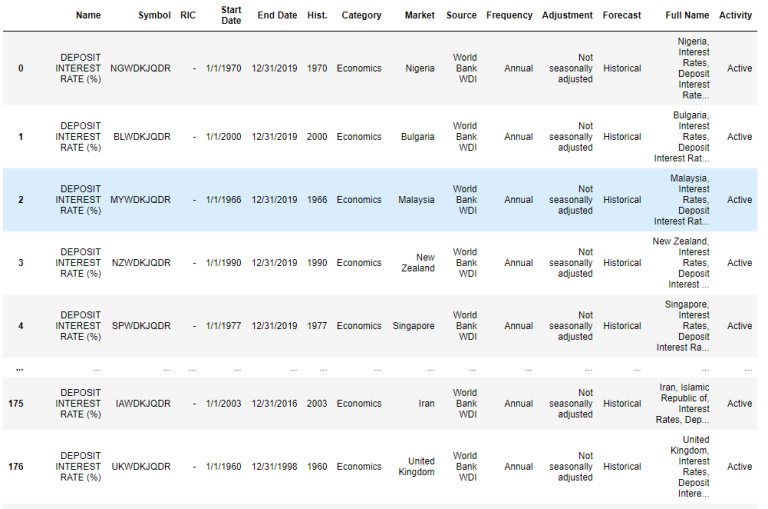
After that, the search results can be downloaded to an excel file. This excel file can be read into a data frame object by calling the pandas.read_html method. Then, only active instruments are selected. In the data frame , the Symbol column contains instrument names and the Market column contains country names.
df = pd.read_html('DepositeInterestRate.xls')
df[0] = df[0][df[0].Activity=="Active"]
df[0]
Requesting data
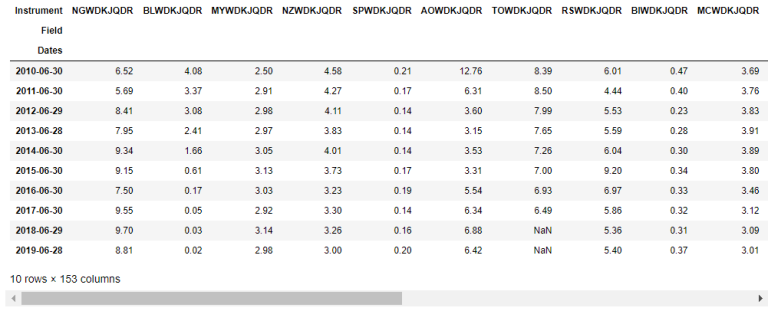
The instrument names in the Symbol column are split into several batch requests. Each batch request containing 20 instruments is sent to the DataStream Web Services to request yearly data for the last ten years. All results are joined to create a data frame object. Then, missing data is removed.
item_list=df[0]["Symbol"].values
batch_list = np.array_split(item_list,len(item_list)/20)
data = None
for batch in batch_list:
temp_dat = ds.get_data(tickers=','.join(batch), start='-10Y',freq='Y')
if data is None:
data = temp_dat
else:
data = data.join(temp_dat)
data.dropna(how='all', inplace=True)
data.dropna(axis=1,how='all',inplace=True)
data
Formatting data
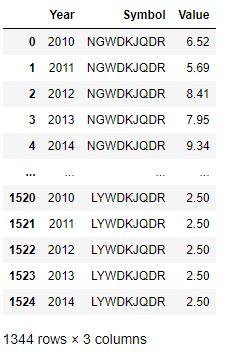
The DataFrame must be re-formatted to a long format with Dates, Symbol, and Value columns. The pandas.DataFrame.melt is called to reformat the DataFrame. Then, rows with missing data or non-positive data are removed. Finally, the Dates column has been converted to Year.
data = data.reset_index().melt(id_vars=["Dates"],
var_name="Symbol",
value_name="Value")
data.dropna(inplace=True)
data = data[data['Value']>0]
data = data.rename({'Dates': 'Year'}, axis=1)
data["Year"] = [int(sublist.split('-', 1)[0]) for sublist in data['Year']]
data
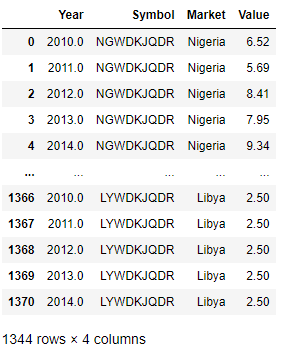
Adding country names
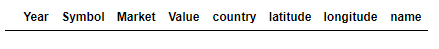
The current data frame doesn't have country names. To add country names, the DataFrame.merge method is called to join the Market column from the list downloaded from the DataStream to the current DataFrame. Then, the required columns (Year, Symbol, Market, and Value) are selected.
data = df[0].merge(data, on=['Symbol'], how='left').dropna()[['Year','Symbol','Market','Value']]
data
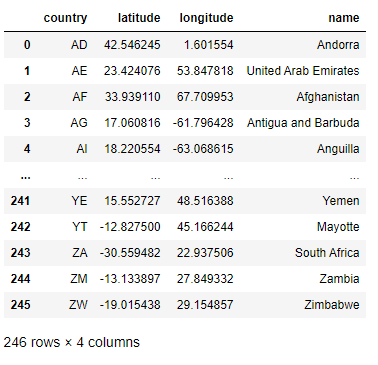
Adding latitudes and longitudes
The latitudes and longitudes of countries are available at countries.csv. Then, loading this file to a data frame object.
countries = pd.read_csv("countries.csv")
countries
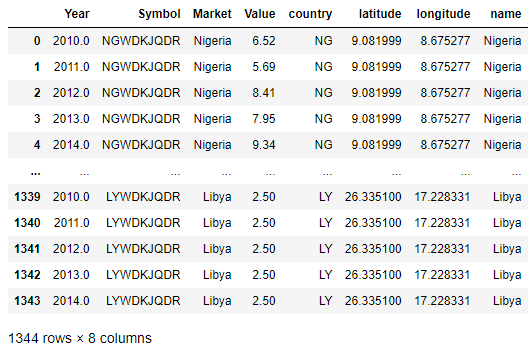
Next, the DataFrame.merge method is called to join the latitude and longitude columns from the countries data frame to the result data frame.
result = pd.merge( data, countries, left_on='Market', right_on='name', how='left')
result
Due to the mismatch of country names, some rows may not have latitudes and longitudes.
result[result['name'].isna()]
The mismatch of country names can be resolved by modifying the name column in the countries.csv or adding a new entry into the countries.csv. Then, re-run this step.
Otherwise, the below code can be called to remove those rows.
result = result[result['name'].notna()]
result
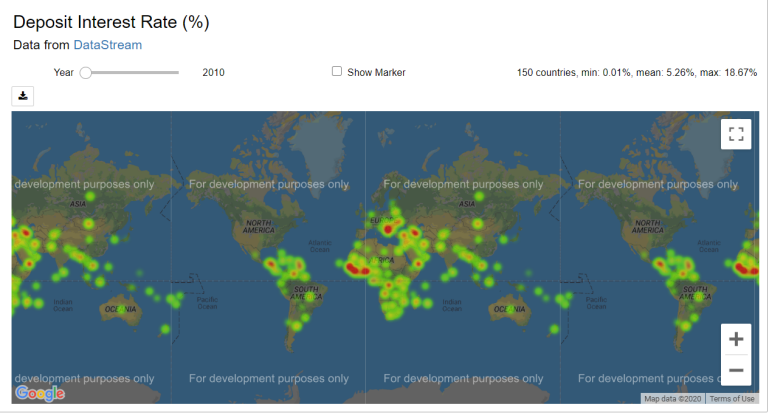
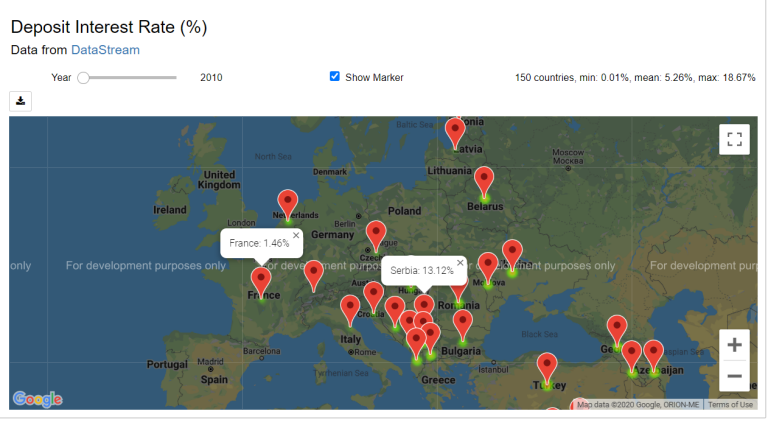
Creating a heatmap with Google Map
Next, a heatmap of deposit interest rate (%) across countries is created by using Google Map. The below code is modified from an example in the jupyter-gmaps document to create a widget which displays an interactive heatmap based on yearly data.
class GmapsWidget(object):
def __init__(self, df, title):
self._df = df
self._heatmap = None
self._marker_layer = None
self._markers = None
self._slider = None
self._checkbox = None
self._is_show_marker = False
initial_year = min(self._df['Year'])
title_widget = widgets.HTML('<h3>{}</h3><h4>Data from <a href="http://product.datastream.com/browse/">DataStream</a></h4'.format(title))
map_figure = self._render_map(initial_year)
controls = self._render_controls(initial_year)
self._container = widgets.VBox([title_widget, controls, map_figure])
def render(self):
display(self._container)
def _on_checkbox_change(self, b):
if b.new == True:
year = self._slider.value
temp = gmaps.marker_layer(self._locations_for_year(year),
info_box_content=self._content_for_year(year))
self._marker_layer.markers = temp.markers
self._is_show_marker = True
elif b.new == False:
self._marker_layer.markers = []
self._is_show_marker = False
def _on_year_change(self, change):
year = self._slider.value
self._heatmap.locations = self._locations_for_year(year)
self._heatmap.weights=self._weights_for_year(year)
self._heatmap.max_intensity = self._max_weights_for_year(year)
self._total_box.value = self._total_casualties_text_for_year(year)
if self._is_show_marker == True:
temp = gmaps.marker_layer(self._locations_for_year(year),
info_box_content=self._content_for_year(year))
self._marker_layer.markers = temp.markers
return self._container
def _render_map(self, initial_year):
fig = gmaps.figure()
self._marker_layer = gmaps.marker_layer([])
self._heatmap = gmaps.heatmap_layer(self._locations_for_year(initial_year),
weights=self._weights_for_year(initial_year),
max_intensity=self._max_weights_for_year(initial_year),
point_radius=10)
fig.add_layer(self._heatmap)
fig.add_layer(self._marker_layer)
return fig
def _render_controls(self, initial_year):
self._slider = widgets.IntSlider(value=initial_year,min=min(self._df['Year']),
max=max(self._df['Year']),
description='Year',
continuous_update=False)
self._checkbox = widgets.Checkbox(False, description='Show Marker')
self._total_box = widgets.Label(value=self._total_casualties_text_for_year(initial_year))
self._slider.observe(self._on_year_change, names='value')
self._checkbox.observe(self._on_checkbox_change)
controls = widgets.HBox([self._slider, self._checkbox, self._total_box],layout={'justify_content': 'space-between'})
return controls
def _weights_for_year(self, year):
return [x for x in self._df[self._df['Year'] == year]['Value']]
def _content_for_year(self, year):
return [ '{}: {}%'.format(y,x) for (x,y) in zip(self._df[self._df['Year']==year]['Value'].values,
self._df[self._df['Year']==year]['name'].values)]
def _max_weights_for_year(self, year):
return self._df[self._df['Year'] == year]['Value'].max()
def _locations_for_year(self, year):
return self._df[self._df['Year'] == year][['latitude', 'longitude']]
def _total_casualties_for_year(self, year):
return int(self._df[self._df['Year'] == year]['Year'].count())
def _total_casualties_text_for_year(self, year):
return '{} countries, min: {}%, mean: {:.2f}%, max: {}%'.format(self._total_casualties_for_year(year),
self._df[self._df['Year'] == year]['Value'].min(),
self._df[self._df['Year'] == year]['Value'].mean(),
self._df[self._df['Year'] == year]['Value'].max())
GmapsWidget(result, 'Deposit Interest Rate (%)').render()
References
- Bugnion, P., 2016. Jupyter-Gmaps — Gmaps 0.8.3-Dev Documentation. [online] Jupyter-gmaps.readthedocs.io. Available at: https://jupyter-gmaps.readthedocs.io/en/latest/index.html [Accessed 12 June 2020].
- Google Developers. 2012. Countries.Csv | Dataset Publishing Language | Google Developers. [online] Available at: https://developers.google.com/public-data/docs/canonical/countries_csv [Accessed 12 June 2020].
- Product.datastream.com. 2020. Datastream Login. [online] Available at: http://product.datastream.com/browse/ [Accessed 12 June 2020].
- Google Developers. 2020. Get An API Key | Maps Embed API | Google Developers. [online] Available at: https://developers.google.com/maps/documentation/embed/get-api-key [Accessed 12 June 2020].
- Rungruengrayubkul, V., 2020. Using Datastream To Generate Coronavirus Cumulative Cases In Geographical Map | DEVELOPER COMMUNITY. [online] Developers.refinitiv.com. Available at: https://developers.refinitiv.com/article/using-datastream-generate-coronavirus-cumulative-cases-geographical-map [Accessed 12 June 2020].
- Maps.worldbank.org. n.d. World Bank Maps. [online] Available at: https://maps.worldbank.org/ [Accessed 12 June 2020].
Downloads
Source Code