
Introduction
Tick history data is an incredible resource for alpha seeking quantitative analysis, data science, and compliance reporting activities. These core tasks are essential to all modern financial companies.
Tick History data primarily serves the use cases of the Front and Middle Office.
Front Office use cases include quant research, creating trading algorithms, identifying trading signals, back-testing trading strategies, data science, etc.
The middle office needs it to perform Transaction Cost Analysis and comply with regulations.
Academic research and market surveillance are a few other use cases for Tick History data.
A challenge with Tick History is that the data sets are quite large. They require significant time to download the data between hosted databases and customer premises, as well as large and reliable storage space, and powerful computing resources to analyse.
All of these imply significant investments in data centres, and their day to day management. Due to these constraints, customers must often restrict themselves to sub-optimal usage of the available data universe.
In this article we shall see how, by leveraging new technologies you can shift away from this traditional data warehouse model to a new one that delivers some very interesting advantages.
Google Cloud Platform and BigQuery
Google’s cloud enterprise data warehouse is becoming well known, and not only in technical circles. There is no need to cover it in detail here, I’ll just mention a few of its features. Apart from being an interesting data storage solution, it also has a built-in data analytics engine called BigQuery. It allows you to analyse large data sets, directly in the cloud. As there is no need to transfer and manage the data, performance is high, and the solution is cost effective.
Google allows queries to be submitted in different ways that include a graphical user interface, a command line tool, or through an API using a variety of client libraries such as Java, .Net or Python.
Queries use SQL (Structured Query Language), a familiar and quite powerful industry standard query language. Both the standard and legacy SQL dialects are supported by BigQuery.
For more details, extensive documentation and training guides, please refer to the Google BigQuery pages.

LSEG Tick History
LSEG Tick History is an archive of historical tick data drawn from our real-time networks.
It covers a universe of more than 80 million active, and more than 900 million retired instruments. It includes OTC (Over The Counter) and exchange-traded instruments from more than 500 trading venues and third-party contributors, as well as unique data sources such as Tradeweb and WM. It gives you unprecedented access to historical, tick-level, global data across all asset classes, letting you build and back-test trading strategies, perform quantitative research and analysis, data science, as well as meet your compliance obligations including transaction cost analysis, market surveillance and MiFID II (Markets in Financial Instruments Directive 2).
Data coverage goes back as far as 1996, with a standardized naming convention based on RIC symbology. We also provide 3rd party industry symbologies for cross-referencing.
Tick History is big data. Approximately 4 terabytes of data are added daily to our database that currently exceeds 5 petabytes.
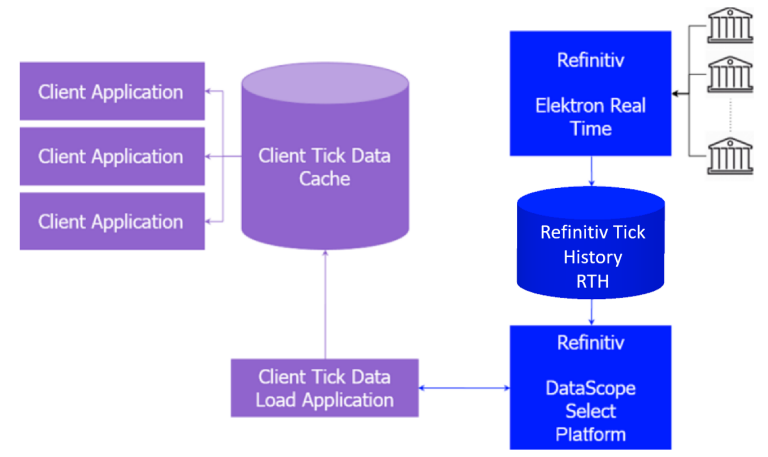
LSEG Tick History has been available for a while on the DataScope Select platform, which provides on-demand data delivery. You can access it via a web-based graphical user interface or use our powerful REST API that delivers efficient programmatic access to the full content and capabilities of the product. More information can be found in our Tick History product page. To find out more about the REST API, see the Tick History section in the Developer Community.
And now LSEG Tick History is also available on Google Cloud.
Changing the paradigm: Tick History data in BigQuery
Thanks to the emergence and popularisation of new technologies like those delivered by Google, we are now able to change the data analysis paradigm entirely. You can easily get rid of the data transfer bottleneck, and shift the burden of storage, management and computing power to the Cloud, thus allowing you to focus on using the data instead of worrying about technicalities.
Here is the news: as of November 2019, you will be able to query and analyse Tick History data directly in the Google Cloud, using BigQuery !
This will deliver huge benefits to you:
- No waiting for huge downloads to complete
- No storage and backups to manage
- No servers or databases to maintain
- Direct access to the industry’s broadest and deepest high-quality archive of tick data, managed transparently for you
- Powerful data queries at your fingertips, using industry standard SQL
All these translate into simplification and cost savings. You can concentrate on the essentials rather than on the logistics, thus gaining time and delivering better and faster results.
Details unveiled
So how did Refinitiv achieve this ?
In the Google cloud, we created a project dedicated to Tick History. Inside that, we created tables for normalized tick history data, on a per venue basis, and partitioned them by day. These tables have been populated with historical data, and are updated daily, a short time after the content sources embargo period expires.
Note: access to these tables is subject to entitlements, based on your Google ID; you will be able to access all the data you signed up for.
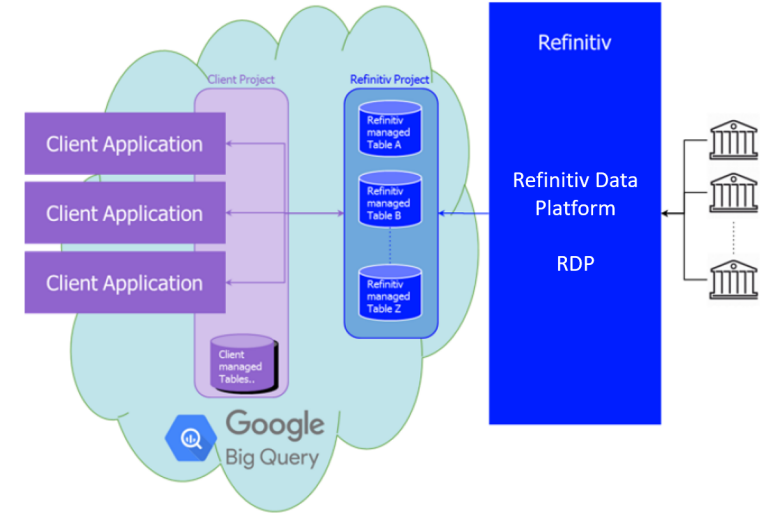
Tick history data flow – the new model
The initial offering has 10 years of history (MiFID II venues start from 2018), for a subset of all venues. The breadth of coverage and depth of history will be extended in the future.
Adjacent content sets, like corporate actions or reference data, will also be made available in BigQuery in a future release; in the meantime, they are accessible via the Tick History REST API (using the DataScope Select servers), or the Refinitiv Data Platform.
Configuring a GCP project to access Tick History
Let us see how to do this in the in the GCP (Google Cloud Platform) console.
To access the LSEG Tick History data sets from your own projects, log into GCP using a Google ID that was entitled for LSEG Tick History.
Then access the Refinitiv project called dbd-sdlc-prod, which can be found under the GCP.REFINITIV.COM organisation.
If you are using the Google Cloud Platform (GCP) console, simply pin the dbd-sdlc-prod project to your own:
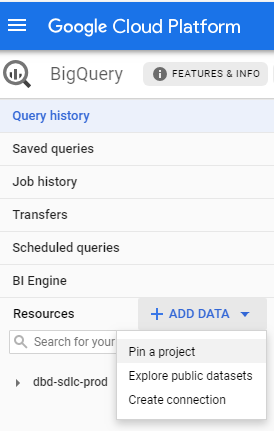
Once you have done this, you will be able to examine the tick history data and run queries on it from within your own BigQuery project.
Tick History data views
Opening the project we just pinned, we see a list of data sets. Their name is in the format <venue>_<view>. The venue is the data source; most of the time this is an exchange. There are two views:
- NORMALISED Tick data (Quotes, Trades, etc.)
- NORMALISEDLL2 Market depth
The market depth view is only available for markets where such data exists. The number of levels of order book depth varies on a per exchange basis.
Let us look at some data, using as example the London Stock Exchange (LSE):
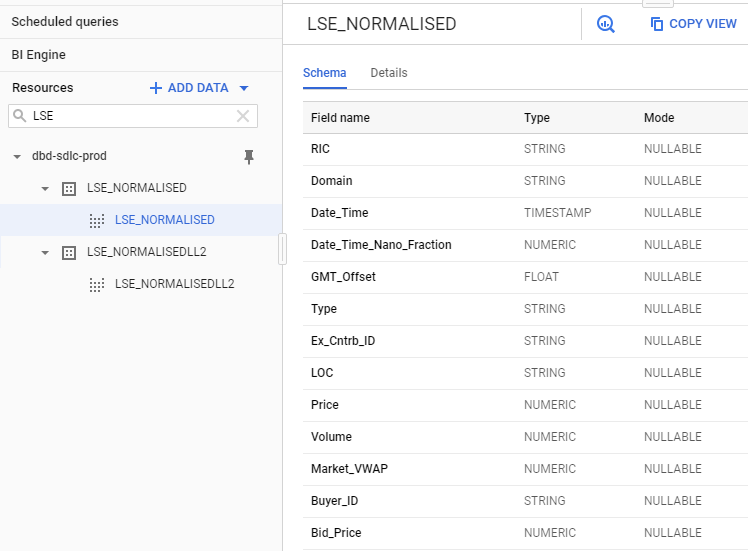
The data schema allows us to find all the field names and types, which will be useful when we query the data.
Running a simple SQL query
Now that we have found the data and understood its schema, we can move on to interrogate it, using SQL queries. You can type the SQL commands directly in the query window.
Let us start by simply retrieving some quotes:
SELECT
Date_Time, RIC, Bid_Price, Bid_Size, Ask_Price, Ask_Size, Qualifiers
FROM
`dbd-sdlc-prod.LSE_NORMALISED.LSE_NORMALISED`
WHERE
RIC LIKE "VOD.L"
AND (Date_Time BETWEEN TIMESTAMP('2019-09-04 00:00:00.000000') AND
TIMESTAMP('2019-09-04 23:59:59.999999'))
AND Type = "Quote"
AND ((Bid_Price IS NOT NULL AND Bid_Size IS NOT NULL) OR
(Ask_Price IS NOT NULL AND Ask_Size IS NOT NULL))
ORDER BY
RIC, Date_Time
LIMIT
100000
We select a few fields, taken from the LSE normalised table view, and limit the results to a single instrument and day.
We are only interested in quotes, and further narrow down the results to those that contain non-null prices and volumes.
As you see, the query is self-explanatory.
After running it, we see the results:
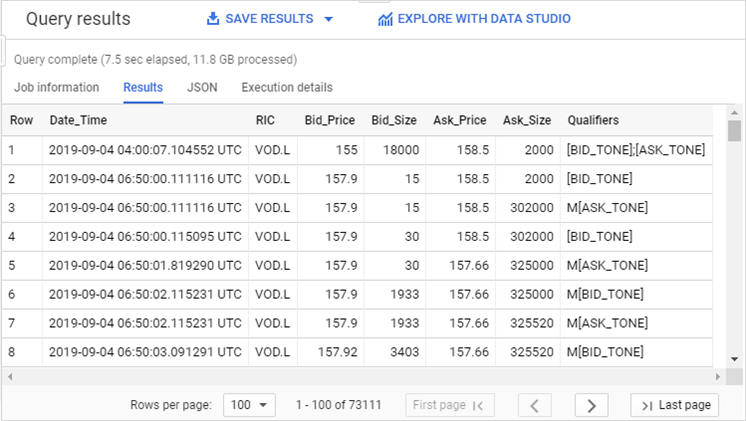
Note: results can easily be exported for further treatment.
Easy analytics using SQL functions
As mentioned in the introduction, there are many use cases for analytics based on tick history data. As an example, let us analyse quotes. We shall calculate several statistics. Among these, the number of quotes is an indication of liquidity, whereas large swings in bid and ask prices or large percentage spread draw attention to instruments that could deliver interesting trading opportunities.
We perform the analysis using SQL functions to count items, find minimum and maximum values, perform calculations, compare strings, and more.
The following query, based on quotes, analyses all available instruments on the London Stock Exchange. For each one it calculates a set of statistics, such as the number of quotes, a few minimum maximum and average values, and more. It also filters out irrelevant quotes based on qualifiers.
We sort the results by the number of quotes, to focus on finding liquidity:
SELECT
RIC,
COUNT(RIC) AS QuotesCount,
MIN(Bid_Price) AS MinBid,
MAX(Bid_Price) AS MaxBid,
MIN(Ask_Price) AS MinAsk,
MAX(Ask_Price) AS MaxAsk,
ROUND(SAFE_DIVIDE(100*(MAX(Bid_Price)-MIN(Bid_Price)),AVG(Bid_Price)),3) AS DeltaBidPercent,
ROUND(SAFE_DIVIDE(100*(MAX(Ask_Price)-MIN(Ask_Price)),AVG(Ask_Price)),3) AS DeltaAskPercent,
ROUND(AVG(Bid_Price),3) AS AvgBid,
ROUND(AVG(Ask_Price),3) AS AvgAsk,
ROUND(AVG(Ask_Price-Bid_Price),5) AS AverageSpread,
ROUND(AVG(SAFE_DIVIDE(100*(Ask_Price-Bid_Price),(Ask_Price+Bid_Price)/2)),5) AS AverageSpreadPercent
FROM
`dbd-sdlc-prod.LSE_NORMALISED.LSE_NORMALISED`
WHERE
RIC LIKE "%.L%"
AND (Date_Time BETWEEN TIMESTAMP('2019-09-04 00:00:00.000000') AND
TIMESTAMP('2019-09-04 23:59:59.999999'))
AND Type="Quote"
AND ((Bid_Price IS NOT NULL AND Bid_Size IS NOT NULL) OR
(Ask_Price IS NOT NULL AND Ask_Size IS NOT NULL))
AND NOT (Qualifiers LIKE 'M[ASK_TONE]')
AND NOT (Qualifiers LIKE 'M[BID_TONE]')
AND NOT (Qualifiers LIKE '[BID_TONE];[ASK_TONE]')
AND NOT (Qualifiers LIKE '[BID_TONE];[ASK_TONE]')
AND NOT (Qualifiers LIKE 'A[BID_TONE];A[ASK_TONE]')
GROUP BY
RIC
ORDER BY
QuotesCount DESC
Here is the result:
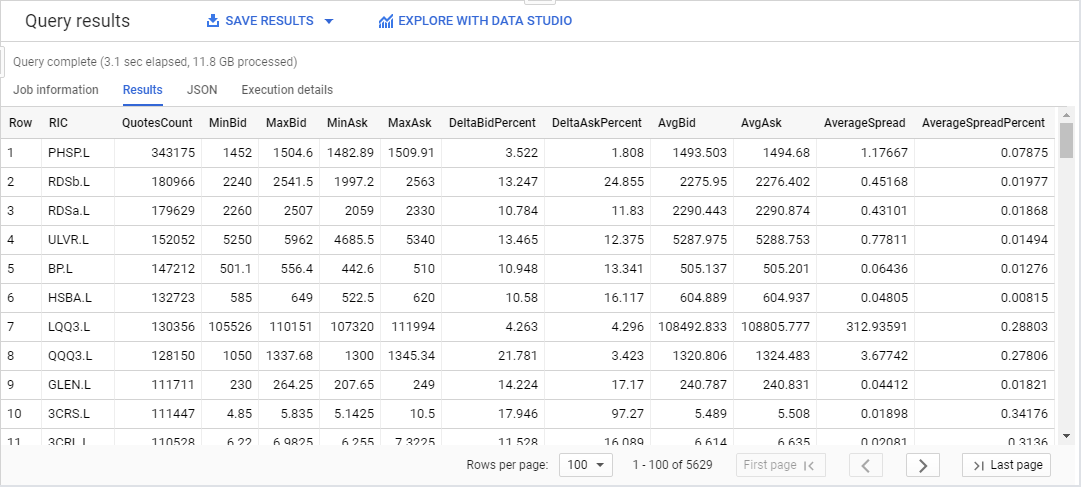
Note: this is level 1 data, the bid and ask prices are always the best bid and ask. For a more detailed view of the offers, we could have used market depth data, which delivers a view of the top of the order book.
As you can see, this is quite powerful: all ticks for the full universe of LSE instruments for an entire day (12GB of data) were analysed in approximately 3 seconds to deliver 11 different calculated values for each of the 5600 instruments !
Let us now see another example, based on trades, again for all instruments on the LSE. For each one it calculates the number of trades, the total traded volume, the minimum and maximum price, the price variation, and a few trade benchmarks such as VWAP, average price and volume. It also filters out irrelevant trades based on qualifiers.
We sort the results by the total volume, to focus on high trading volume instruments:
SELECT
RIC,
ROUND(SAFE_DIVIDE(SUM(Volume*Price),SUM(Volume)),3) AS VWAP,
COUNT(RIC) AS TradesCount,
SUM(Volume) AS TotalVolume,
ROUND(AVG(Volume),0) AS AvgTradeVolume,
MIN(Price) AS MinPrice,
MAX(Price) AS MaxPrice,
ROUND(SAFE_DIVIDE(100*(MAX(Price)-MIN(Price)),AVG(Price)),3) AS DeltaPricePercent,
ROUND(AVG(Price),3) AS AvgPrice
FROM
`dbd-sdlc-prod.LSE_NORMALISED.LSE_NORMALISED`
WHERE
RIC LIKE "%.L%"
AND (Date_Time BETWEEN TIMESTAMP('2019-09-04 00:00:00.000000') AND
TIMESTAMP('2019-09-04 23:59:59.999999'))
AND Type="Trade"
AND Volume >0
AND Price >0
AND NOT (Qualifiers LIKE 'Off Book Trades%')
AND NOT (Qualifiers LIKE '%Previous Day Trade%')
AND NOT (Qualifiers LIKE '%CLS%')
AND NOT (Qualifiers LIKE 'U[ACT_FLAG1];U[CONDCODE_1]%')
AND NOT (Qualifiers LIKE '46---A---P----[MMT_CLASS]')
AND NOT (Qualifiers LIKE '46-1-A---P----[MMT_CLASS]')
AND NOT (Qualifiers LIKE '47---A---J----[MMT_CLASS]')
AND NOT (Qualifiers LIKE '47---A---P----[MMT_CLASS]')
AND NOT (Qualifiers LIKE '%Auction%')
GROUP BY
RIC
ORDER BY
TotalVolume DESC
Here is the result:
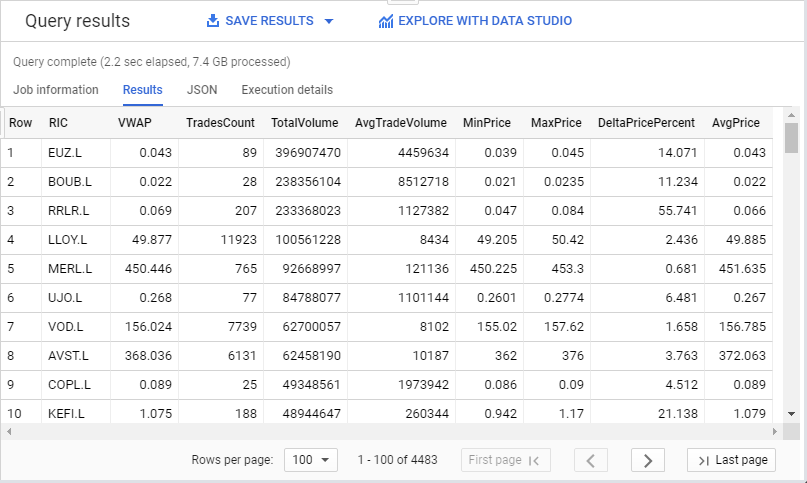
In a similar way you can build other analytics based on quotes, trades or market depth data, summarise data in bars, calculate benchmarks like average price or VWAP, compare execution prices, find interesting instruments by volume or price change, and much more.
Optimising SQL queries
It is recommended to apply some best practices when building queries, to optimize them for performance and cost effectiveness:
- Minimize the amount of data you query and analyse.
- Avoid repeatedly transforming data via your SQL queries.
- Order operations to maximize performance.
- Use a LIMIT clause with large sorts.
Following these simple rules will help you optimize your queries. For more detailed information and tips, refer to the Tick History in Google BigQuery tutorials set, and to the following Google documentation:
Conclusion
As we have seen, it is very easy to access LSEG Tick History data and analyse Gigabytes of data it in a matter of seconds using Google BigQuery. As all the requests rely entirely on SQL, you don’t need any other skills to create powerful analytics in a very short time.
To see this in live action, see the Tick History in Google BigQuery webinar:
If you would like to dig further, you will find more examples of SQL queries, and more technical details, in the Tick History in Google BigQuery tutorials set.