

Introduction
Maximum Drawdown (MDD) is an indicator of downside risk, with large MDDs suggesting that down movements could be volatile. However, while MDD measures the most significant loss, it does not account for the frequency of losses and the size of any gains.
In this article, we're going to retrieve pricing data of funds from Datastream Python library and calculate their MDDs using Python code.
What can you do with a maximum drawdown?
MDD can be used to measure the risk of losing money from the portfolio performance as it is the most negative cumulative return over a given time period. In other terms, it is the maximum percentage loss that occurred in a return data series, measured as the worst period of "peak to valley" performance for the fund, regardless of whether the drawdown consisted of consecutive months of negative performance. The maximum drawdown is based on simple returns.
The formula to calculate Maximum Drawdown is
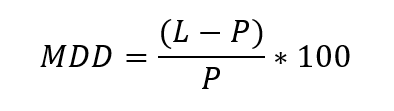
Where,
P is the Peak (the highest price) of the period
L is the lowest price of the period
Example of Maximum Drawdown
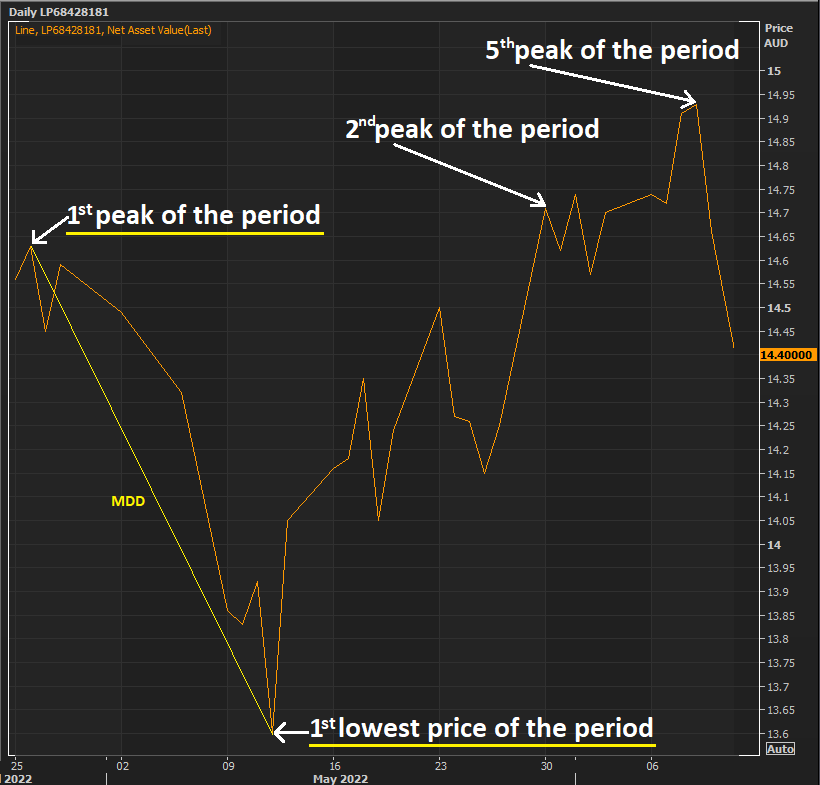
In this article, we’re going to calculate the MDD with the daily prices of funds. To make it easier to explain, let’s look at this period of the sample fund above. During this period, the 1st peak of this fund is 14.63 AUD, and it decreases to 13.60 AUD, which is the 1st lowest price of the period, then it increases to 14.71 AUD and 14.93 AUD, which are 2nd peak and 5th peak of the period respectively. However, as MDD is the most negative cumulative return over a given time period, the prices to be calculated are the 1st peak and 1st lowest price, not the 5th peak, which is the maximum price during this period (you may see the image above to see the MDD line that shows the most negative cumulative return).
The MDD calculation of this fund is
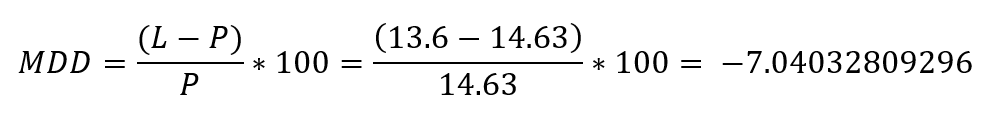
Which is around -7.04 (rounded from -7.04032809296)
Now that we know how to calculate the MDD. Let's calculate MDDs of funds using Python code with the data retrieved from the DataStream Python library.
Calculate Maximum Drawdown with Python
We’re going to implement the Python function to calculate MDD, its input data is the dictionary of instruments that contain the dictionary of its price (value) of each date (key), below is an example input with two instruments.
{('RIC1':
{'2022-02-22': 14.65,
{'2022-02-23': 14.61,
{'2022-02-24': 14.99,
{'2022-02-25': 15.03,
{'2022-02-26': 15.31,
{'2022-02-27': 15.05},
('RIC2':
{'2022-02-22': 4.55,
{'2022-02-23': 4.61,
{'2022-02-24': 4.99,
{'2022-02-25': 5.43,
{'2022-02-26': 5.31,
{'2022-02-27': 5.05}}
Here's how we're going to calculate the MDD of each instrument
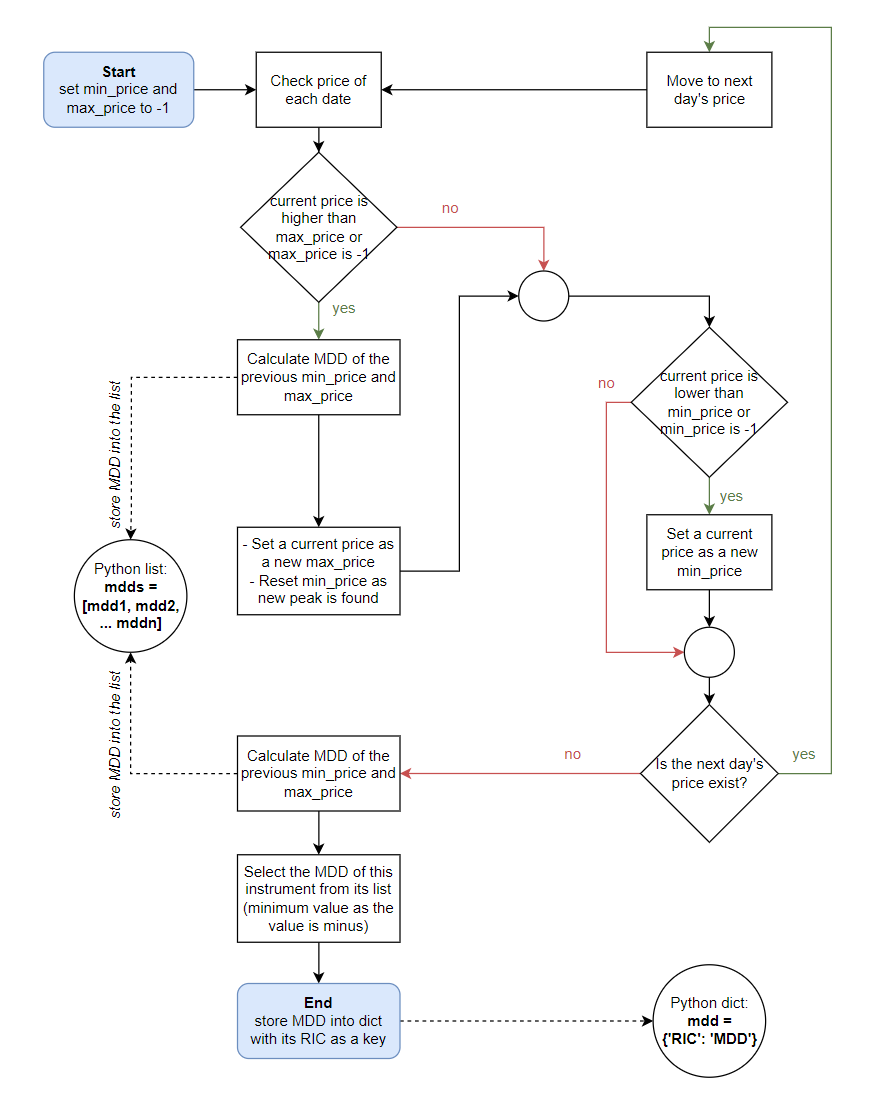
With the same logic of this flowchart, the code below can be used to get the MDD of each instrument
def cal_mdd(price_dict):
# (1) create Python dictionary to store MDD of each instrument
mdd = {}
for _ in price_dict:
# (2) declare variable to store min and max price of each range
max_price, min_price = -1, -1
# (3) create Python list to store drawdown of each range
mdds = []
for date in price_dict[_]:
#print(str(date)+": "+str(price_dict[_][date]))
price = price_dict[_][date]
# (4) set new min/max price if this price is higher than current max price
if price > max_price or max_price == -1:
if min_price != -1 and max_price != -1:
# (5) calculate drawdown % of the previous min-max
mdds.append((min_price-max_price)/max_price*100)
max_price = price
min_price = -1
# (6) set only new min price if this price is lower than current min price
if price < min_price or min_price == -1:
min_price = price
# (7) calculate drawdown % of the latest min-max
mdds.append((min_price-max_price)/max_price*100)
# (8) store maximum drawdown into Python dictionary with its instrument as a key
## use min() function as the drawdowns are less than zero
mdd[_] = min(mdds)
return(mdd)
Retrieve and calculate the data using DataStream
In this section, I will walk through a DataStream Web Service example used to retrieve economic indicators by countries. The example uses the DatastreamPy library to connect and retrieve data from Datastream. To use this Python library, please refer to the Getting Started with Python document.
Step 1) Below is the stuff required to get started with DataStream
- DSWS API service enabled
- Child ID and password
- Your login ID is usually designed to start with Z, have 3 letters and 3 numbers
- for example ZXXX123
- Python 3.6 or above (I’m using Python 3.9.12 here)
- Python libraries used
- DatastreamPy=1.0.10
- DateTime=4.4
- pandas=1.3.5
Step 2) Searching for the instrument that you’re looking for
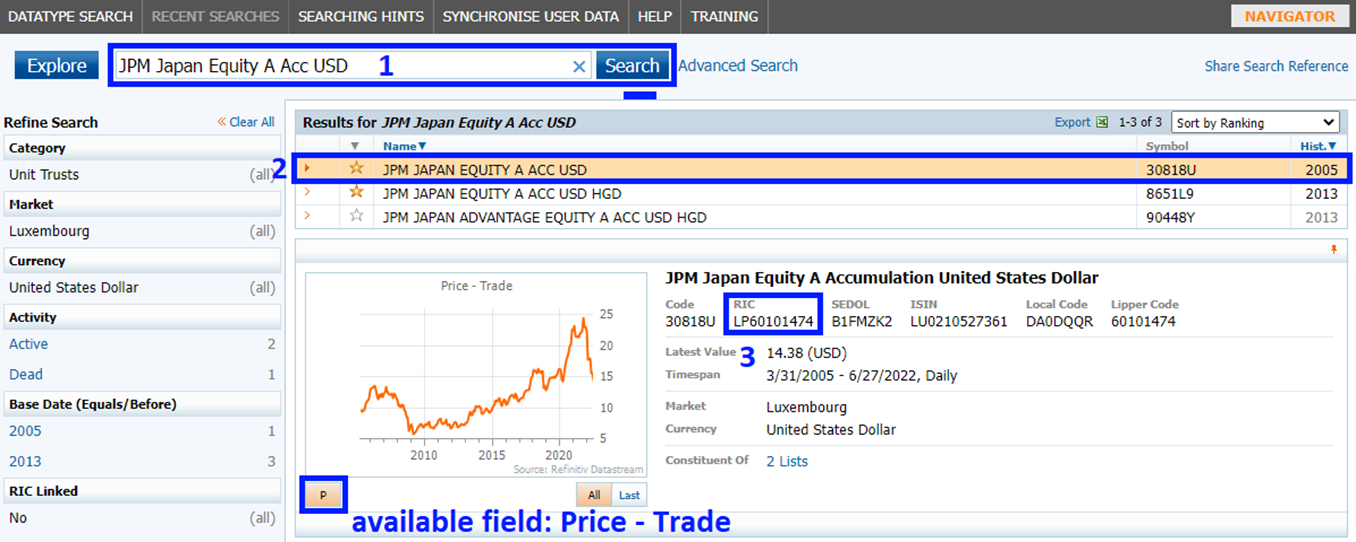
The RIC, a ticker-like code used and maintained by Refinitiv to identify financial instruments, is required to get the data of an instrument, to search for the instrument's RIC, the datatype search tool can be used. First, log in with your DataStream credentials. Then type the keyword you’d like to search for (box '1' in the screenshot below). It's shown that the RIC of JPM Japan Equity A Acc USD fund is LP60101474 (boxes '2, 3' in the screenshot below). The ‘P’ button at the bottom left of the search result is the available field of this instrument, which is Price-Trade (box 'available field: Pride - Trade' in the screenshot below)
Step 3) Let's do the coding part
1. Import necessary libraries, which are DatastreamPy for Datastream Python library (for more detail, please check Getting Started with Python) and isnan from math Python library for checking the NaN value in the dataframe
import DatastreamPy as dsws
from math import isnan
2. Do the authentication with DataStream credentials
Replace <username> with your username and <password> with your password.
ds = dsws.Datastream(username = '<username>', password = '<password>')
3. Use the code below to get daily price in the last 1 year of these three instruments using DataStream.
| Parameter | Description | Example format |
|---|---|---|
| tickers | Tickers here are set to 3 RICs (LP68511418,LP68087222,LP68663339), this can be replace with any RICs of fund | tickers = 'RIC1,RIC2,RIC3,...,RICn' tickers = 'LP68511418,LP68087222,LP68663339' |
| fields | Set to 'X', which is the default value. The default value can be checked using Datastream datatype search tool provided earlier | fields = ['FIELD'] fields = ['X'] |
| start | Take the date of the last 12 months as a starting point for the data | start = '-12M' |
| end | Take today's date as an ending point of the data | end = '0M' |
| freq | Frequency of the data, D, which is day is used in this case | freq = 'D' |
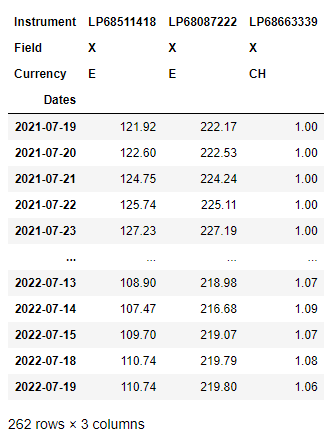
df = ds.get_data(tickers = 'LP68511418,LP68087222,LP68663339', fields = ['X']
, start = '-12M', end = '0M', freq='D')
display(df)
4. Then we're going to prepare the Python dictionary of price of all the dates of each instrumet by converting the dataframe to Python dictionary and set the RIC as a key, price as a value.
def data_prep(df):
price_dict = df.to_dict()
price_dict = dict((key[0], value) for (key, value) in price_dict.items())
for date in price_dict:
price_dict[date] = dict((key, value) for (key, value) in price_dict[date].items() if not isnan(value))
return(price_dict)
price_dict = data_prep(df)
price_dict
5. Calculate MDD of this price_dict with the function defined above
mdd_last_1_year = cal_mdd(price_dict)
mdd_last_1_year
Now we already have a Python dictionary named mdd_last_1_year that contain the instrument's RIC as a key and its MDD as a value
{'LP68511418': -21.79250166383198,
'LP68087222': -14.638469783164323,
'LP68663339': -36.206896551724135}
What can you do with MDDs?
Let's look at an example of using MDD as a factor to consider investing in any instruments, I'm going to do the backtesting by looking at the yearly MDD of the previous year and select funds with less MDD to be invested, then check the result by checking their return of the previous year to see if it helps me to loss less.
First, we're going to look at the instruments below, which are the active mutual funds in technology in the Lipper Global schema classification with the green strategy.
| Instrument | Instrument description |
| LP40221832 | AGF Global Sustainable Equity Fund |
| LP40109383 | Artisan Sustainable Emerging Markets Fund |
| LP40229598 | BlackRock Global Impact Fund |
| LP40229602 | BlackRock International Impact Fund |
| LP40228661 | PIMCO Climate Bond Fund |
| LP40048702 | Pax High Yield Bond Fund |
| LP40221655 | Pear Tree Essex Environmental Opportunities Fd |
| LP40005806 | Putnam Sustainable Leaders Fund |
From this, we're retrieving their price using Datastream and calculating their MDDs with the same code that was mentioned in the previous section, but with the list of these instruments instead.
instruments = 'LP40221832,LP40109383,LP40229598,LP40229602,LP40228661,LP40048702,LP40221655,LP40005806'
df_prev_year = ds.get_data(tickers = instruments, fields = ['X']
, start = '-24M', end = '-12M', freq='D')
price_dict = data_prep(df_prev_year)
mdd_prev_year = cal_mdd(price_dict)
mdd_prev_year
Here's their yearly MDDs of the last year.
{'LP40221832': -8.717978107627955,
'LP40109383': -11.370786516853938,
'LP40229598': -10.834371108343701,
'LP40229602': -19.906166219839147,
'LP40228661': -2.4832855778414498,
'LP40048702': -2.2889842632331923,
'LP40221655': -16.933066933066936,
'LP40005806': -8.81461598406788}
Regarding this data, instead of investing in all of the instruments, I'm going to select only the instruments with less MDD (which have a higher value as the MDD is a minus number). Hence, I select half of the instruments with less MDD, which are
| Instrument | Previous year MDD |
| LP40221832 | -8.717978107627955 |
| LP40228661 | -2.4832855778414498 |
| LP40048702 | -2.2889842632331923 |
| LP40005806 | -8.81461598406788 |
Next, let's see the result by checking their return for the last year, this data is being retrieved using Eikon Data API (for more detail, check Eikon Data API Overview and its quick start guide)
The code below is used, the data is taken from the field named 'TR.TotalReturn1YrCrossAsset', which is 1-year total return that incorporates the price change and any relevant dividends for the last year.
import eikon as ek
ek.set_app_key('### Your Eikon App Key ###')
year_return, err = ek.get_data(['LP40221832','LP40109383','LP40229598','LP40229602','LP40228661','LP40048702','LP40221655','LP40005806'],
['TR.TotalReturn1YrCrossAsset'])
year_return_dict = dict(zip(year_return['Instrument'], year_return['1 Year Total Return Cross Asset']))
And their returns are as the table below, we could see that the instruments that we decided to invest for are also a top 4 of return compared to other instruments in the list.
| No. | Instrument | Yearly return | Decide to invest? |
| 1 | LP40221832 | -23.2527537 | Yes |
| 2 | LP40109383 | -32.323344 | No |
| 3 | LP40229598 | -32.2921591 | No |
| 4 | LP40229602 | -35.0363303 | No |
| 5 | LP40228661 | -11.3077075 | Yes |
| 6 | LP40048702 | -14.267095 | Yes |
| 7 | LP40221655 | -32.3474739 | No |
| 8 | LP40005806 | -19.5482169 | Yes |
Conclusion
Regarding the backtesting above, it shows that checking the MDD can help prevent the loss from the investment by avoiding the instruments with the huge MDD. However, in the real scenario, other factors should be considered before the investment as well. Feel free to discover more articles in this developer forum to learn how the data can be used in any cases.
Last but not least, The Maximum Drawdown (MDD) is an indicator of downside risk over a specific time period, which is daily data of the last 1 year in this case. This data can be used to check the fund's past performance to be a part of the factors to consider investing in it. I hope you have fun with this article and if you have any questions or issues regarding API usage, please don’t hesitate to post your question on our Q&A forum
Reference
- DataStream Web Service (including Overview, Quickstart guide, Documentation, Useful resources provided for downloading, tutorials)
- DataStream datatype search tool
- Register or Log in to applaud this article
- Let the author know how much this article helped you