
This article demonstrates how to extract the time series from Refinitiv using Eikon data API for Python. Then, we can use it for forecasting the time series e.g. using ARIMA (Autoregressive integrated moving average) model in this article.
Introduction to Eikon Data API for Python
Eikon Data API for Python provides access to time series(historical data), current market data and news. The API is for the users who require programmatic access to Eikon data on the desktop. It is designed for ease of use and for rapid application development. It powers in-house or third-party desktop apps with Refinitiv data. It leverages Eikon data and entitlements to simplify market data management and reporting. For more details of Eikon Data API for Python, please refer to Eikon Data API page.
Introduction to ARIMA model[1]
An ARIMA model is a class of statistical models for analysing and forecasting time series data. ARIMA consists of the following key aspects of the model
- AR: Autoregression. A model that uses the dependent relationship between an observation and some number of lagged observations.
- I: Integrated. The use of differencing of raw observations (e.g. subtracting an observation from an observation at the previous time step) in order to make the time series stationary.
- MA: Moving Average. A model that uses the dependency between an observation and a residual error from a moving average model applied to lagged observations.
Each of these components are explicitly specified in the model as a parameter. A standard notation is used of ARIMA(p,d,q) where the parameters are substituted with integer values to quickly indicate the specific ARIMA model being used.
The parameters of the ARIMA model are defined as follows:
- p: The number of lag observations included in the model, also called the lag order.
- d: The number of times that the raw observations are differenced, also called the degree of differencing.
- q: The size of the moving average window, also called the order of moving average
A value of 0 can be used for a parameter, which indicates to not use that element of the model. This way, the ARIMA model can be configured to perform the function of an ARMA model, and even a simple AR, I, or MA model.
Prerequisite
Eikon Application or Eikon Data API Proxy. Both acts as an interface between the Eikon Data API Python library and the Eikon Data Platform. For this reason, the Eikon application or Eikon Data API Proxy must be running when you use the Eikon Data API Python library. You can download Eikon from MyRefinitiv. To download Eikon Data API Proxy, please refer to Eikon Data API Downloads tab
- Eikon username and password. Please contact Refinitiv sales or account team to obtain this info.
- App Key. Every application using the Eikon Data API must identify itself using App Key. Please refer to step 2. Create an App Key for your application in Eikon Data API Quick Start
- The Python library for the Eikon Data API. Please refer to step 3. Install the Python library for the Eikon Data API in Eikon Data API Quick Start
Implementation
Eikon Data API for Python provides get_timeseries(..) function to access time series for one or several RICs. The below is the declaration function and its parameters:
get_timeseries(rics, fields='*', start_date=None, end_date=None, interval='daily', count=None, calendar=None, corax=None, normalize=False, raw_output=False, debug=False)
Return: Time series pandas data frame. Please check out Eikon Data API Usage and Limits Guideline.
Parameters:
| Name | Type | Description |
| rics | string or list of strings | Single RIC or List of RICs to retrieve historical data for |
| start_date | string or datetime.datetime or datetime.timedelta |
Starting date and time of the historical range. string format is: '%Y-%m-%dT%H:%M:%S'. e.g. '2016-01-20T15:04:05'.datetime.timedelta is negative number of day relative to datetime.now(). Default: datetime.now() + timedelta(-100). You can use the helper function get_date_from_today, please see the usage in the examples section |
| end_date | string or datetime.datetime or datetime.timedelta | End date and time of the historical range. string format could be
datetime.timedelta is negative number of day relative to datetime.now(). Default: datetime.now() You can use the helper function get_date_from_today, please see the usage in the examples section |
| interval | string | Data interval. Possible values: 'tick', 'minute', 'hour', 'daily', 'weekly', 'monthly', 'quarterly', 'yearly'.Default: 'daily' |
| fields | string or list of strings | Use this parameter to filter the returned fields set.Available fields: 'TIMESTAMP', 'VALUE', 'VOLUME', 'HIGH', 'LOW', 'OPEN', 'CLOSE', 'COUNT'. By default all fields are returned |
| count | int, optional | Max number of data points retrieved. |
| calendar | string, optional | Possible values: 'native', 'tradingdays', 'calendardays'. |
| corax | string, optional | Possible values: 'adjusted', 'unadjusted' |
| normalize | boolean | If set to True, the function will return a normalized data frame with the following columns 'Date','Security','Field'.If the value of this parameter is False the returned data frame shape will depend on the number of rics and the number of fields in the response. There are three different shapes - One ric and many fields - Many rics and one field - Many rics and many fields. Default: False Remark: This parameter has a less precedence than the parameter rawOutput i.e. if rawOutput is set to True, the returned data will be the raw data and this parameter will be ignored |
| raw_output | boolean | Set this parameter to True to get the data in json format if set to False, the function will return a data frame which shape is defined by the parameter normalize Default: False |
| debug | bool | When set to True, the json request and response are printed. Default: False |
Raises:
- Exception. If request fails or if server returns an error.
- ValueError. If a parameter type or value is wrong
We will use this function with the parameters below to get the time series as an input to forecast the series using ARIMA model.
- rics is any specified RIC
- fields is 'CLOSE' which is the close price of each day.
- interval is 'daily'
- start_date to any specified past date
Hence, the source code to use this function will be like an example below:
import pandas as pd
import eikon as ek
#set app key to identify the application on Refinitiv Platform
ek.set_app_key(<APP_KEY>)
#a RIC that you want to get time series
RIC = 'IBM.N'
#start date that you want to get time series; it is in format yyyy-mm-dd
start_date = '2018-01-02'
#get time series till the last market close date using eikon.get_timeseries(..) function
df = ek.get_timeseries(RIC, 'CLOSE', interval='daily', start_date=start_date)
#display time series data frame
df
Note:
- Please change <APP_KEY> to your App Key. Please refer to Prerequisite step 3 to obtain the App Key.
- Before you run the application, please make sure that Eikon Application or Eikon Data API Proxy is running.
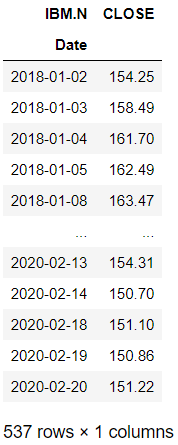
This source code will return the daily CLOSE price time series of RIC IBM.N since 2 Jan 2018 till the last market close day as an example below:
Next, you can use the time series retrieved from get_timeseries(..) function with ARIMA model to forecast the future time series as an example source code below:
import matplotlib
import matplotlib.pyplot as plt
import numpy as np
from datetime import timedelta, datetime
from statsmodels.tsa.arima_model import ARIMA
from statsmodels.tsa.holtwinters import ExponentialSmoothing
from statsmodels.tsa.stattools import acf, pacf
from statsmodels.tsa.stattools import adfuller
#function to forecast using ARIMA Model
#input is time series data frame(df) got from eikon.get_timeseries(..)
#and forecast end date which is in format yyyy-mm-dd
def ARIMA_model_forecast(df, forecast_end_date):
#Set the start and end forecast date time
#first date is 1 day after time series. The last date is the forecast_end_date parameter
_e_date = datetime.fromtimestamp(datetime.timestamp(df.index[-1]))
e_date = _e_date + timedelta(days = 1)
e_date = e_date.strftime('%Y-%m-%d')
#find differences of time series which is input of ARIMA model
df['df_1diff'] = df['CLOSE'].diff()
df = df[df['df_1diff'].notnull()]
lag_acf = acf(df['df_1diff'], nlags=50)
lag_pacf = pacf(df['df_1diff'], nlags=50, method='ols')
new_spot = df['df_1diff'].resample('D').ffill()
#call ARIMA model which p=1,d=0 and q=1 with differences of time series
arma_model = ARIMA(new_spot, order=(1,0,1))
results = arma_model.fit(disp=0)
residuals = pd.DataFrame(results.resid)
#focast time series
predictions_ARIMA = pd.Series(results.fittedvalues, copy=True)
predictions_ARIMA_cumsum = predictions_ARIMA.cumsum()
predictions_ARIMA_final = pd.Series(df['CLOSE'].iloc[0], index=new_spot.index)
predictions_ARIMA_final = predictions_ARIMA_final.add(predictions_ARIMA_cumsum, fill_value=0)
new_spot = df.CLOSE.resample('D',label='right').ffill()
es_model = ExponentialSmoothing(new_spot, trend='add', damped=False, seasonal='mul', seasonal_periods=30)
es_results = es_model.fit()
predicted_values = es_model.predict(params=es_results.params, start=e_date, end=forecast_end_date)
#create data frame from forecast timeseries
preds = pd.DataFrame(index= pd.date_range(start=e_date, end=forecast_end_date), data=predicted_values, columns=['CLOSE'])
#Plot graph of past and forecast timeseries
plt.figure(figsize=(16,7))
plt.plot(new_spot, label='Actual')
plt.plot(preds, label='Forecast', color='red')
plt.legend(loc='best')
plt.show()
return preds
#end date that you want to forecast
forecast_end_date = '2020-03-31'
#call the function to forecast time series with ARIMA model
forecast = ARIMA_model_forecast(df,forecast_end_date)
#display forecast time series
forecast
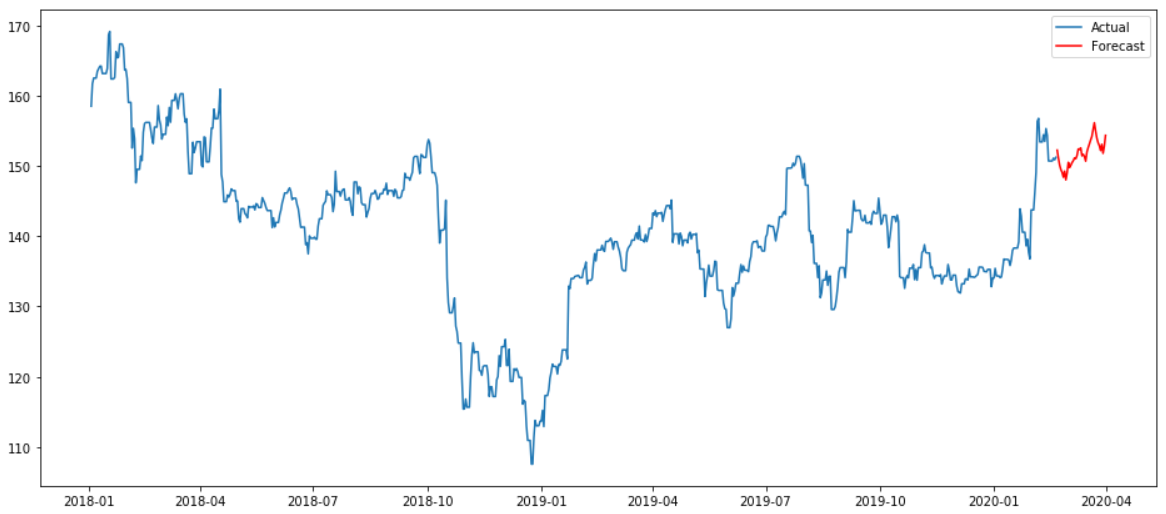
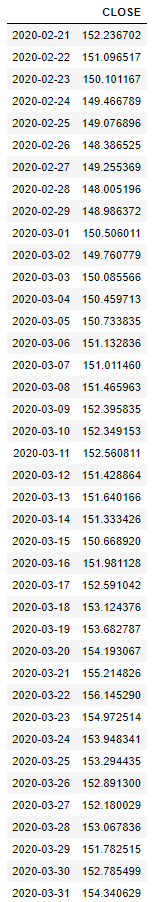
The source code will plot the graph consisting of the actual time series got from eikon.get_timeseries(..) and forecast time series using ARIMA model. Then, display the forecast time series like an example below:
Troubleshooting
- Failed to establish a new connection:
Error on checking port 9000 : HTTPConnectionPool(host='localhost', port=9000): Max retries exceeded with url: /api/v1/data (Caused by NewConnectionError('<urllib3.connection.HTTPConnection object at 0x000001C4C33D47C8>: Failed to establish a new connection: [WinError 10061] No connection could be made because the target machine actively refused it'))
...
Resolution: Make sure that Eikon Desktop or Eikon Data API Proxy is running.
- Invalid key:
2020-02-20 10:22:22,228 P[22984] [MainThread 20416] Error code 403 | Client Error: {"ErrorCode":1401,"ErrorMessage":"Application id <APP_KEY> is invalid"}
Resolution: Make sure that you run the application with the correct App Key. You can check it from App key Generator
- The response does not start from the start date
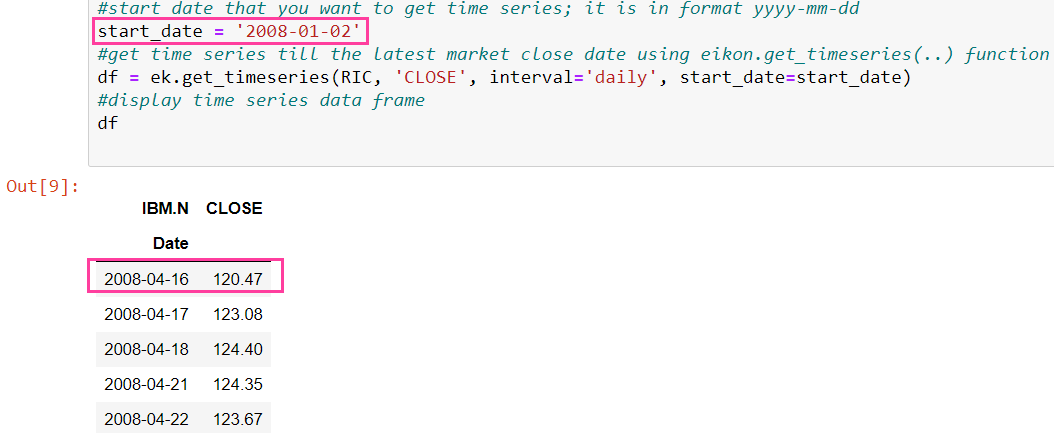
Resolution: From the example above the start_date is 2008-01-02 but the response starts from 2008-04-16. The reason is the get_timeseries function has datapoint limit. The exceeded datapoint(oldest datapoint) will be truncated. For more details, please check out Eikon Data API Usage and Limits Guideline
Summary
At the end of this article, you should be able to get time series from Refinitiv using get_timeseries(..) function in Eikon Data API for Python. Then, you can use the time series with ARIMA model to make forecasts or use the time series for other purposes.
References
- "Autoregressive Integrated Moving Average Model" in "How to Create an ARIMA Model for Time Series Forecasting in Python". Retrieved Feb 20, 2020, from https://machinelearningmastery.com/arima-for-time-series-forecasting-with-python/
- "Eikon Data API", Refinitiv Developer Community, https://developers.refinitiv.com/eikon-apis/eikon-data-api
- "Autoregressive integrated moving average", in Wikipedia, Retrieved Feb 20, 2020, from https://en.wikipedia.org/wiki/Autoregressive_integrated_moving_average